the environment
This page sets out our vision and approach to improving the world around us and reducing our negative impact. Among other things, we share information about our CO2 emissions, the use of responsibly sourced raw materials and the impact of our packaging.
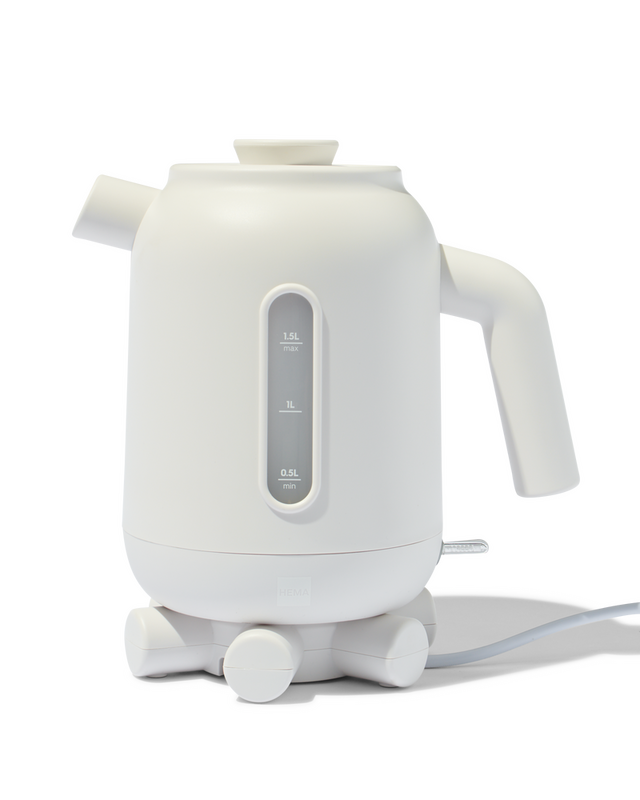
New in: the updated binkie kettle (a white cordless kettle that sits on the stove) now with a 1.5-litre capacity and a gauge glass with a water level indicator. This glass allows you to see how full it is and how much you need to refill it. If you just heat the amount of water you need, the water will boil much faster, saving you energy.
scroll down
climate change
2023 was the warmest year on record. That is why, more than ever, it is important to act with urgency and remain committed to the Paris Climate Agreement and to limit temperature rise to 1.5°C.
A key achievement this year was the development of climate targets. This sets out our ambitions in terms of reducing our CO2 emissions in our own operations and in our value chains. These targets are fully in line with the global 1.5°C target and the Science Based Targets Net-Zero standard.

climate footprint in 2022
In 2022, we made significant progress by mapping our scope 1, 2, and 3 emissions for the first time. We did this by conducting a baseline measurement for the year 2019, based on the Greenhouse Gas Protocol. We built on this in 2023 by conducting a second measurement for the year 2022. We deliberately excluded the years 2020 and 2021 from the measurements because of COVID. Those years would be an unrealistic representation of our climate footprint.
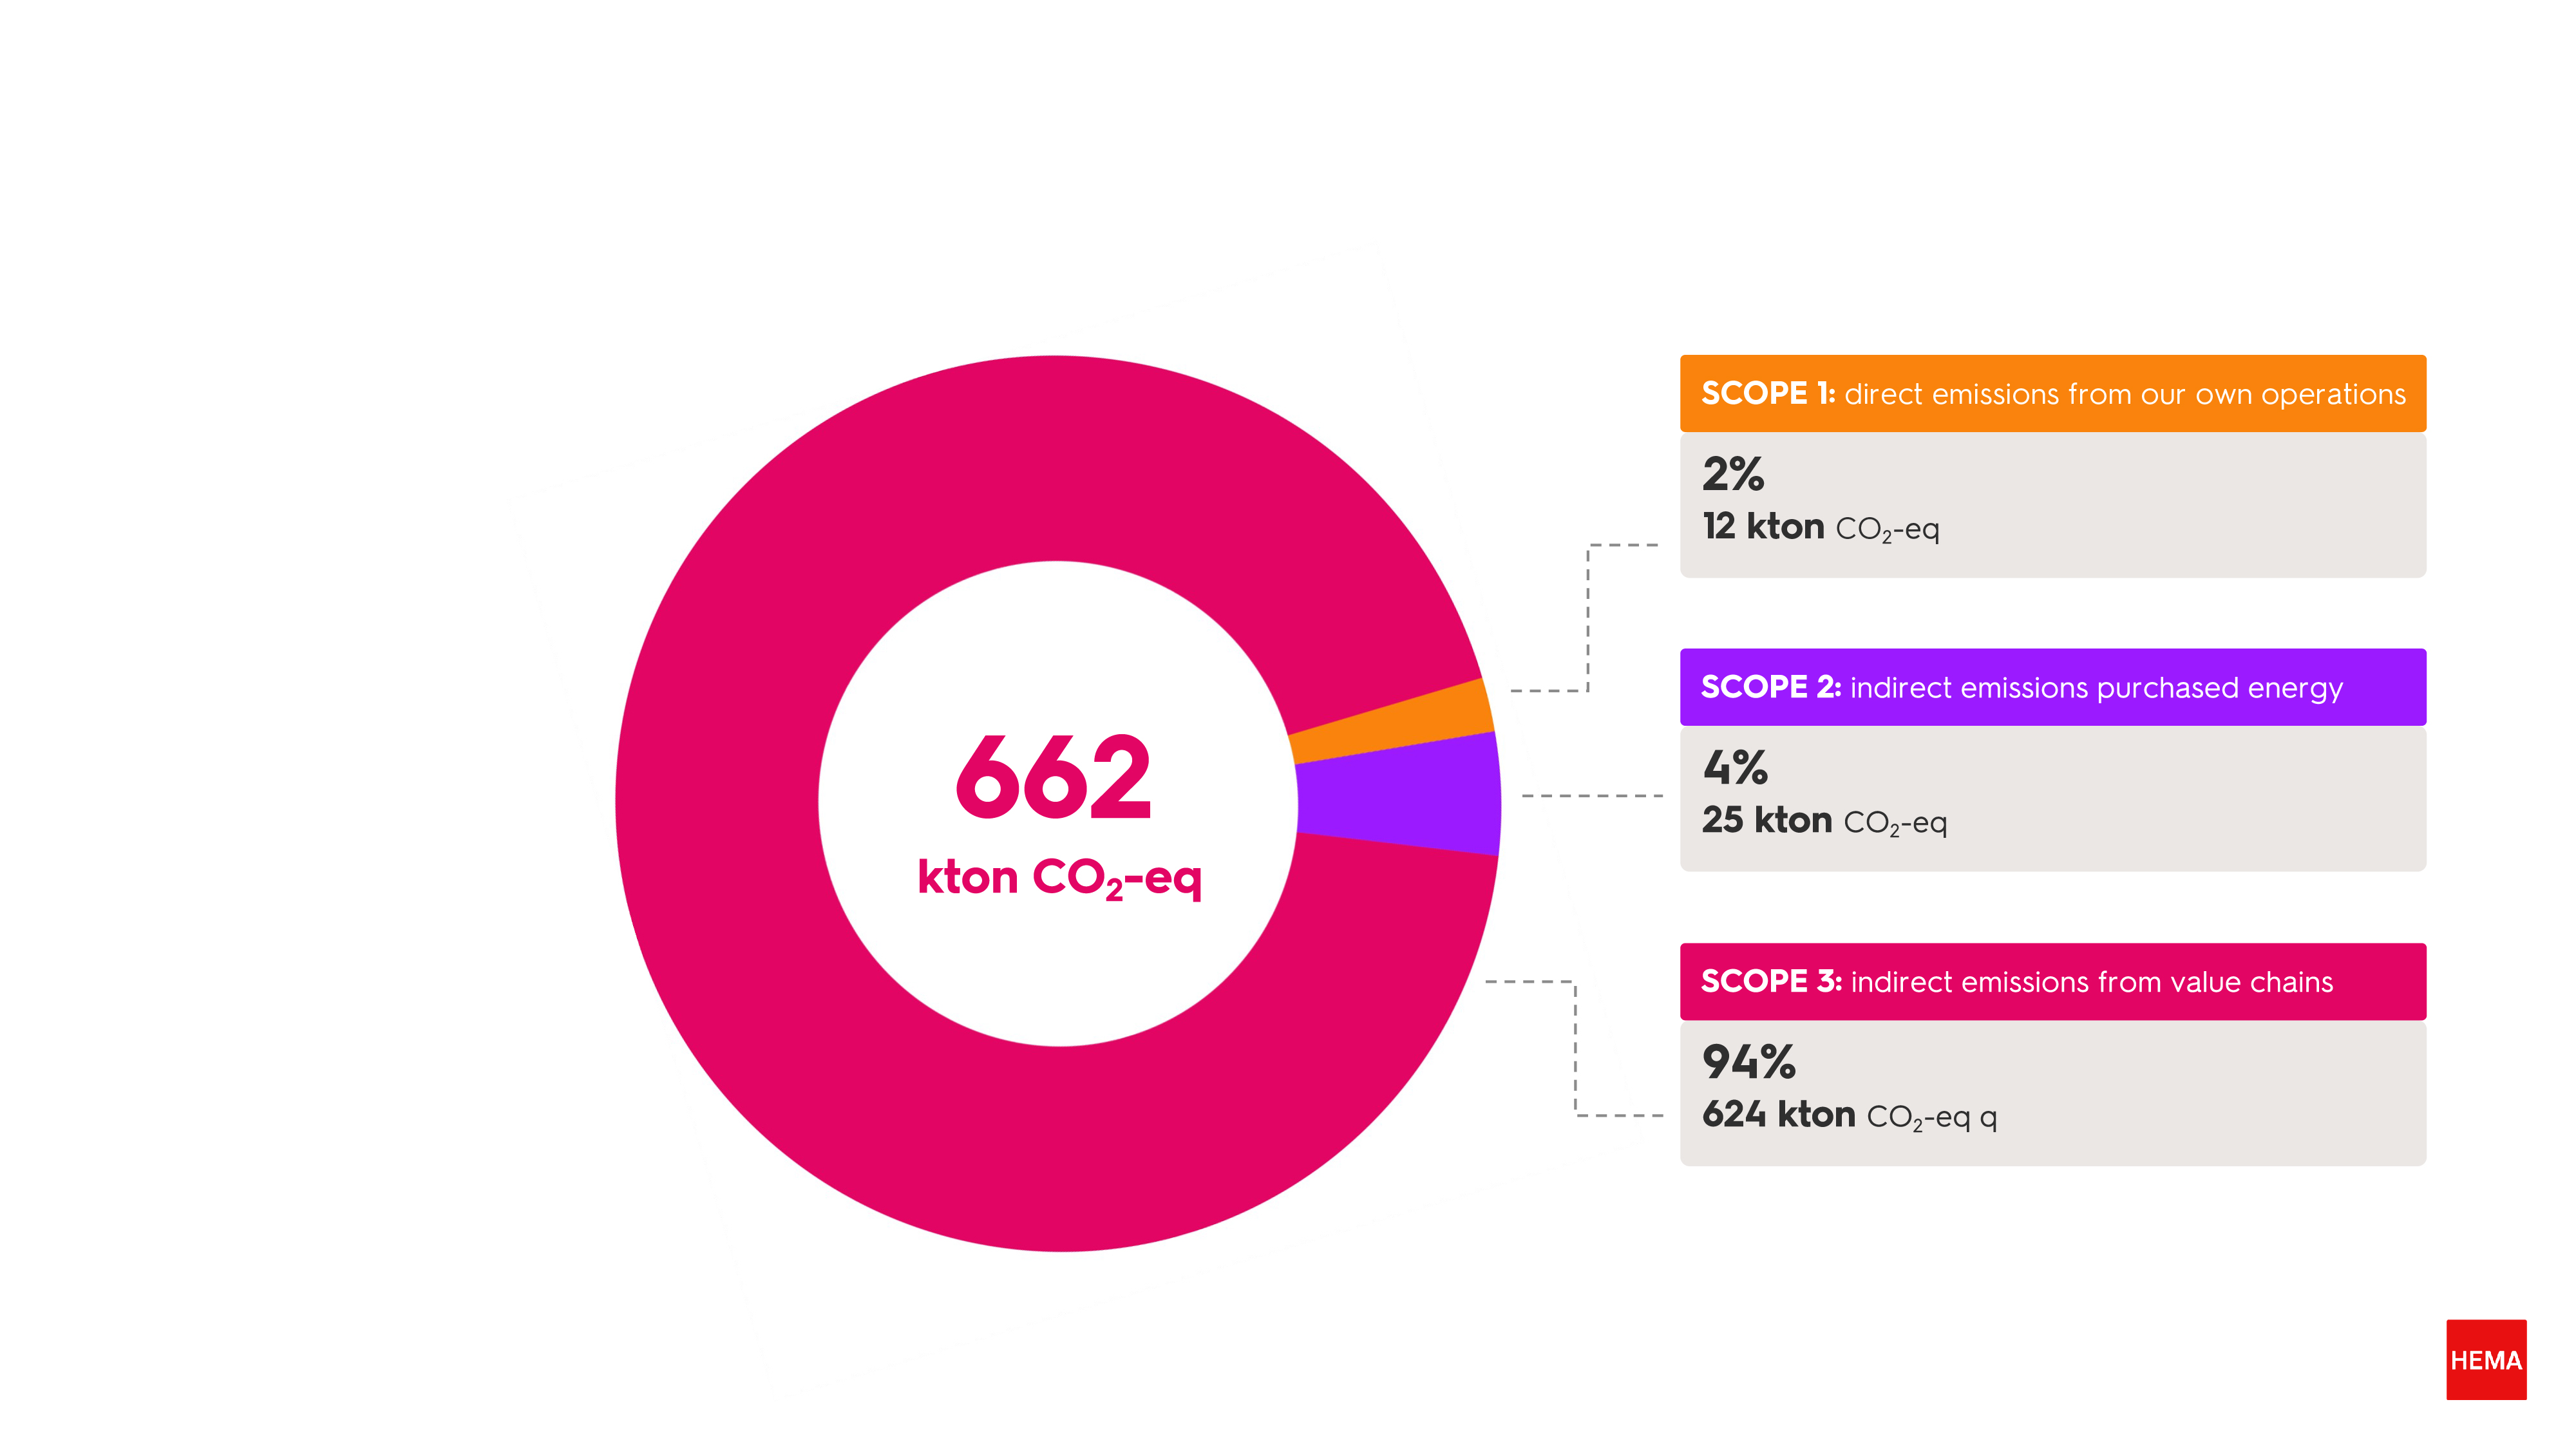
In 2022*, HEMA's total climate footprint was 662 kilotonnes of CO2-eq. Within this, our own operations (scope 1 and 2) are responsible for 6% of total emissions. In terms of the rest of our emissions, 94%, come from indirect emissions in our value chains (scope 3). Compared to **, our overall climate footprint decreased by 8% in the period up to 2022. In 2019, the climate footprint was 717 kilotonnes of CO2-eq.
climate footprint in 2022
scope 1 & 2
own operations
Our own operations cost energy. We light our shops. We transport our goods from distribution centres to branches. And we chill our products in cold stores.
In recent years, we have done much to reduce emissions from our own operations. From investing in LED lighting and climate control, to installing automatic sliding doors so that heat or cool air is contained inside the shop. Formula components, such as refrigerators, are also becoming more fuel-efficient, and we are increasingly using cleaner fuels in our own transport, such as biodiesel. Among other things, this has led to a 34% reduction in our CO2 emissions within our own operations from 2019 to 2022. Scope 1 greenhouse gas emissions decreased from 19 to 12 kilotonnes CO2-eq, and scope 2 emissions from 38 to 25 kilotonnes CO2-eq. Only emissions from purchased heat increased by 227% simply because more of it was purchased.
scope 3
value chains
Includes all indirect CO2 emissions resulting from activities in our value chains. Think of the extraction of raw materials and materials contained in our products. Producing them and transporting them to distribution centres. The use of aircraft for business trips and waste disposal. And also, for example, the electricity consumption required at customer premises to boil water with our binkie kettle.
In the period from 2019 to 2022, total scope 3 CO2 emissions decreased by 7%, from 634 to 592 kilotonnes CO2-eq. Emissions from many categories within scope 3 have significantly decreased. Particularly within the categories: waste generated in operations, business travel and energy consumption in franchises, emissions have significantly decreased. The impact of the utilisation phase of products sold has also decreased significantly, but this is due to a new calculation method.
However CO2 emissions from category 3.1, purchased goods and services, have increased slightly in recent years, by 1%. From 482 ktonnes CO2-eq in 2019 to 485 ktonnes CO2-eq in 2022. This category contains our product range and its production. As this involves a significant quantity of items, this category is the largest and most important within our climate footprint and targets. In the coming years, it will be a focus point to achieve emission reductions within our range and its production.
*Because of the time currently required to calculate a CO2 measurement, we are looking back to 2022, and it is not yet possible to do this for 2023.
**The 2019 zero CO2 measurement has been revised due to finding better calculation methods and more accurate data (mainly in relation to purchase quantities) during the 2022 measurement. We applied these improvements retrospectively to the 2019 baseline measurement. This reduced the 2019 climate footprint from 933 to 717 ktonnes CO2-eq.
| 2019 | 2022 | Change 2022 compared to 2019 (%) | |||
|---|---|---|---|---|---|
| Total | 717.549 | % | 662.292 | % | -8% |
| Scope 1 | 18.810 | 3% | 12.465 | 2% | -34% |
| 1.1 Stationary Combustion | 7.387 | 1% | 5.573 | 1% | -25% |
| 1.2 Mobile Combustion | 4.900 | 1% | 3.384 | 1% | -31% |
| 1.4 Fugitive Emissions | 6.522 | 1% | 3.508 | 1% | -46% |
| Scope 2 | 38.564 | 5% | 25.362 | 4% | -34% |
| 2.1 Purchased Electricity | 38.174 | 5% | 24.465 | 4% | -36% |
| 2.3 Purchased Heating | 274 | 0% | 897 | 0% | 227% |
| 2.4 Purchased Cooling | 115 | 0% | 0 | 0% | -100% |
| Scope 3 | 660.176 | 92% | 624.465 | 94% | -5% |
| 3.1 Purchased Goods & Services | 482.323 | 67% | 485.846 | 73% | 1% |
| 3.3 Fuel & Energy Related Activities not in S1 or S2 | 7.718 | 1% | 6.521 | 1% | -16% |
| 3.4 Upstream Transportation & Distribution | 15.092 | 2% | 17.663 | 3% | 17% |
| 3.5 Waste Generated in Operations | 4.025 | 1% | 3.521 | 1% | -13% |
| 3.6 Business Travel | 465 | 0% | 188 | 0% | -60% |
| 3.7 Employee Commuting | 12.250 | 2% | 12.415 | 2% | 1% |
| 3.11 Use of Sold Products | 75.263 | 10% | 39.326 | 6% | -48% |
| 3.12 EOL Treatment of Sold Products | 31.041 | 4% | 37.522 | 6% | 21% |
| 3.14 Franchises | 31.999 | 5% | 21.463 | 3% | -33% |
reduction measures
Achieving our climate goals requires innovation and robust collaboration with our stakeholders across the value chain. From shop employee to supplier and designer to customer. We need everyone in this mission. The biggest CO2 reduction opportunities for the coming years are engaging our production chains and innovation within the product range, by looking for more sustainable materials and/or applying circular design principles. We are currently working on a HEMA-wide package of measures through which we intend to achieve our short and long-term climate goals. This package will broadly consist of the following strategies:
Reducing energy consumption & energy efficiency
- Optimisation of energy use: Implementation of energy efficiency programmes in our shops, distribution centres and offices. This includes the use of more energy-efficient lighting, heating, ventilation, formula components and air-conditioning (HVAC) systems.
- Energy monitoring systems: Introduction of smart meters to better monitor energy consumption and address inefficiencies quickly.
Transition to renewable energy
- Solar-energy: Installation of solar panels on roofs of buildings where possible and cost-effective. This reduces dependence on the grid and uses sustainable energy sources.
- Procurement of renewable energy: Switching to certified green power for all facilities.
Innovation of products and materials
- The development of more sustainable and/or circular products: The development of products with a lower carbon footprint through the use of more sustainable materials, circular design principles and/or more efficient production methods.
- Reduction of packaging: Reduction of packaging materials through innovative design and the use of recyclable or compostable materials.
Making production chains more sustainable
- Sustainable purchasing policy: Assessment and selection of suppliers based on their sustainability and environmental performance. Increase collaboration with suppliers committed to reducing their own emissions.
- More Sustainable Transport: Optimising transport and logistics processes to reduce fuel consumption and emissions. This includes using cleaner fuels, efficient route planning and increasing stocking density.
HEMA's climate footprint
2019 - 2030
"Certification helps the customer and us to independently verify the claims we make. We continued to expand the labels on our products in 2023 and will take major follow-up steps in 2024"
Brigit van Daelen
Technical Specialist Sustainable Product
certifications
It is important to HEMA that suppliers use certified materials in production. This way, we know that our products have been produced under conditions that are in line with our guidelines and meet the certification requirements.
By 2022, HEMA will be certified by Control Union (CU) to carry GOTS and Textile Exchange certification. These labels and other accepted certifications and standards are listed in the table below. We have also reviewed the internal safeguarding of the quality labels. A number of raw materials are fully certified. At the same time, we are also encountering challenges in achieving the targets.
In 2023, HEMA sold the same number of items with the Better Life Quality label compared to 2022. Yet this nevertheless translates into a 1% increase in ‘non-certified items’. This is caused by the discontinuation of a number of meat products that did bear the Better Life Certification. Significant steps will be taken in 2024 to switch a large number of items to BL certification with the aim of having 100% of our offered meat bearing the Better Life Certification by 2026. As such, we have moved our goal of certifying 100% meat with 1* Better Life Certification by one year.
In 2023, HEMA sold the same number of items with the Better Life Quality label compared to 2022. Yet this nevertheless translates into a 1% increase in ‘non-certified items’. This is caused by the discontinuation of a number of meat products that did bear the Better Life Certification. Significant steps will be taken in 2024 to switch a large number of items to BL certification with the aim of having 100% of our offered meat bearing the Better Life Certification by 2026. As such, we have moved our goal of certifying 100% meat with 1* Better Life Certification by one year.
food
100%
rainforest alliance
cocoa
100%
fairtrade of rainforest alliance
tea
100%
fairtrade of rainforest alliance
coffee
100%
RSPO
palm oil
62%
at least 1* better life
meat
64%
organic or pasture-fed
fresh dairy products
86%
MSC or ASC
fish
certifications
food
cocoa
tea
coffee
palm oil
meat
fresh dairy products
fish
2021
100%
88%
100%
100%
60%
77%
88%
2022
100%
100%
100%
100%
66%
81%
86%
2023
100%
100%
100%
100%
62%
64%
86%
non-food
100%
organic or Better Cotton
cotton
100%
RDS
down
88%
FSC
wood & paper
97,5%
RSPO
palm oil (cosmetics)
certifications
non-food
cotton
down
wood & paper
palm oil (cosmetics)
2021
100%
100%
94,6%
91,4%
2022
100%
100%
95,34%
94,9%
2023
100%
100%
88%
97,5%
packaging
We sell some of our products packaged. We have been committed to increasing our positive impact for years, and are constantly looking for innovative alternatives. In 2023, our specialists focused on the following actions and related goals:
- reducing packaging materials.
- the use of high-quality raw materials.
- promoting the recyclability of packaging after use.
our approach and results
reducing packaging materials.
Reducing material use is central to the design of new packaging. We are aiming for more compact packaging with less material, while exploring the possibility of more efficient construction. Although packaging is often needed for barcodes and product presentation, we are committed to minimising the amount of packaging material. For our colouring books and gift bags, the barcode is printed directly on the product, and for items such as candles and tableware, we only use barcode stickers.
Our reduction targets are:
- 25% less plastic in consumer packaging by 2022 compared to 2019
- 25% less consumer packaging in 2025 compared to 2019
In 2023, we reduced plastic packaging material per item by as much as 29% compared to 2019. In doing so, we still managed to achieve this target (2022 result was 23% reduction). All product categories contributed to this, such as replacing plastic bags and hooks with cardboard alternatives in underwear and fashion accessories (such as hats and gloves), and offering more gift items in less packaging, where customers can use (reusable) wrapping paper. In the ‘cooking & dining’ group, as many as 70% of items only have a barcode sticker.
Although cardboard is often used as an alternative to plastic, this can result in heavier packaging. For example, we have replaced plastic and Styrofoam with smart cardboard solutions for kitchen appliances, making the packaging fully recyclable but a lot heavier.

better raw materials
In addition to reducing packaging materials, we aim to use high-quality raw materials. We prefer recycled or FSC-certified paper and cardboard, and aim to use at least 20% recycled or bio-based plastic in our consumer packaging by 2025. However, the availability of recycled plastic continues to be a challenge due to its higher cost and limited availability. Currently, 12% of our consumer packaging consists of recycled plastic, which is still far below our target. When recycled plastic is not an option, we try to avoid plastic.
Our transport packaging is predominantly made of recycled material, such as recycled cardboard for transport boxes and recycled plastic for polybags.
29
%
less plastic
in consumer packaging in 2023 than in 2019

recyclability
Our goal is to have all packaging recyclable by 2025. We have already made significant progress, 79% of our items come in recyclable packaging. And our outer packaging consists of recyclable materials such as LDPE polybags and cardboard boxes, we collect all this packaging at the shop, and it goes directly to the recycler.
We also improve recyclability by replacing small plastic hooks with cardboard alternatives, making the packaging easier to recycle. Another improvement in the chocolate range is the replacement of paper stickers on plastic bags with stickers of the same material as the bag, or the use of a paper string instead of a plastic string on some toy items. The latter is only a very small packaging component, but in fact always ends up in the residual stream.
We use knowledge and tools from various stakeholders, such as recycling checks from the Sustainable Packaging Knowledge Institute, to determine which solutions are the most recyclable.

actions and targets
4%
less consumer packaging in 2023
target in 2025
25%
actions and targets
base year 2019
less consumer packaging in 2023
2021
1%
2022
0%
2023
4%
Based on total package weight.
We are reporting on all items with the HEMA logo purchased from 1 February 2023 to 21 January 2024. We are comparing the amount of packaging material per item with our comparison year 2019.
29%
less plastic in consumer packaging in 2023
target in 2025
25%
actions and targets
base year 2019
less plastic in consumer packaging in 2023
2021
20%
2022
23%
2023
29%
We are reporting on all items with the HEMA logo purchased from 1 February 2023 to 21 January 2024. We are comparing the amount of packaging material per item with our comparison year 2019.
12%
recycled or bio-based plastic in consumer packaging in 2023
target in 2025
20%
actions and targets
base year 2019
recycled or bio-based plastic in consumer packaging
2021
12%
2022
13%
2023
12%
Average reduction in kg of consumer plastic packaging.
We are reporting on all items with the HEMA logo purchased from 1 February 2023 to 21 January 2024. We are comparing the amount of packaging material per item with our comparison year 2019.
79%
recyclable packaging in 2023
target in 2025
100%
actions and targets
base year 2019
recycled or bio-based plastic in consumer packaging
2021
62%
2022
64%
2023
79%
We are reporting on all items with the HEMA logo purchased from 1 February 2023 to 21 January 2024. We are comparing the amount of packaging material per item with our comparison year 2019.
