environment
HEMA has been a shop for everyone – for 100 years. With attractive, practical and affordable products of good quality. That’s what makes HEMA unique: we’re there for you from your baby’s very first grow-with-me bodysuit right through to the last mourning candle that burns. A lot has changed in a hundred years, but that love for everyday life has always remained the same.


scroll down
We design smarter so that products can be used for a long time. This also includes carefully selecting our materials. We carry out in-house quality testing and encourage customers to look after their products properly so that they last longer.
To produce high-quality products, we need a healthy environment. From the cotton used in our vests to the wood used for our kitchenware and the fertile soil for our coffee: our products have their origins in nature. That is why we are taking responsibility. Step by step, we are reducing our negative impact on the environment. We are focussing on five interlinked themes, organised into the following three pillars:
- climate change
- nature (pollution, water, biodiversity)
- use of materials and the circular economy
The themes are closely interlinked, so we have opted for an integrated approach. Through strategies and action plans covering our entire product range, we are reducing our negative impact across a range of areas simultaneously, including through circular design, more sustainable materials, reduced packaging and more efficient production.
climate change
our material impacts, risks and opportunities
The impact of climate change is evident everywhere. Global temperature rises, shortages of raw materials and more extreme weather are affecting us both as individuals and as a company. At the same time, we know that our own activities also contribute to climate change. We emit greenhouse gases from our own operations (scope 1 & 2) and throughout the value chain (scope 3). That is why we are working hard to reduce our carbon footprint. In addition, we are preparing for the consequences of climate change, so that we can continue to operate responsibly in the long term.
climate footprint
Last year, we reported on our climate footprint for 2023, due to the time required to calculate our CO2 emissions. In this report, we are catching up; we are reporting on our climate footprint for 2024 and 2025 and have had it validated by our external auditor.
Every year, we take significant steps forward and continue to invest in improving the quality of our data. Whereas we previously relied on sector averages, we now have a clear understanding of the specific composition of products and can link these directly to appropriate emission factors. This enables us to implement more targeted reduction measures, both within our own operations and across the value chain.
A key example of this is that, for the 2024 carbon footprint, we have included the energy consumption and sources of production sites in the measurement for the first time. This gives us a clearer picture of which sites account for the largest share of our emissions, enabling us to further refine our focus.
To make these improvements possible, we are working with a new partner, Root Sustainability, to calculate our carbon footprint for 2024 and 2025. The switch to this platform enables us to monitor our impact more accurately and focus our efforts more effectively on reducing it.
our climate footprint in 2025



KPIs and objectives
E1
climate change

IRO


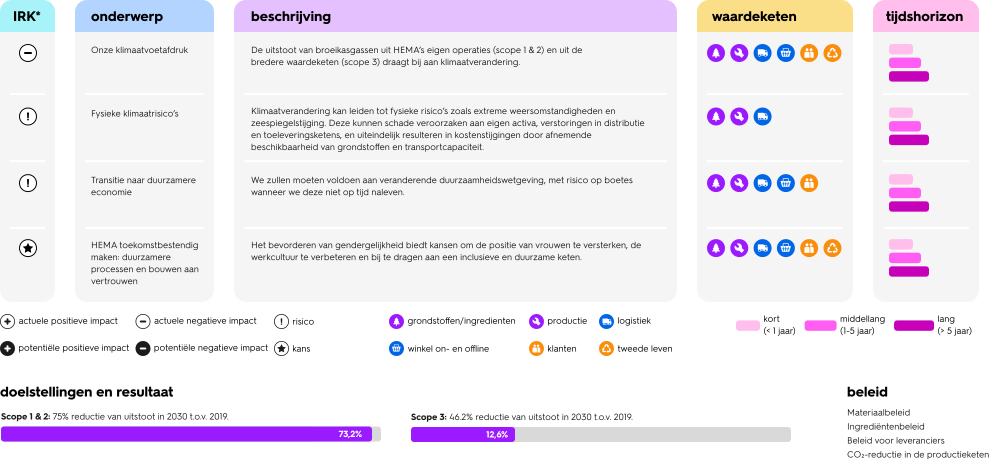
topic
Our climate footprint
Physical climate risks
Transition to a more sustainable economy
Making HEMA future-proof: more sustainable processes and building trust
description
Greenhouse gas emissions from HEMA’s own operations (scope 1 & 2) and from the wider value chain (scope 3) contribute to climate change.
Climate change can lead to physical risks such as extreme weather conditions and rising sea levels. These can cause damage to a company’s own assets, disrupt distribution and supply chains, and ultimately lead to cost increases due to reduced availability of raw materials and transport capacity.
We will have to comply with changing sustainability legislation, with the risk of fines if we fail to comply in time.
Promoting gender equality offers opportunities to empower women, improve the working culture and contribute to an inclusive and sustainable supply chain.
value chain


time horizon

current positive impact
current negative impact
risk

potential positive impact

potential negative impact
opportunity
raw materials/ingredients
production
logistics
online and offline store
customers
second life
short (< 1 year)
mediium
(1-5 year)
long (> 5 year)
objectives and results
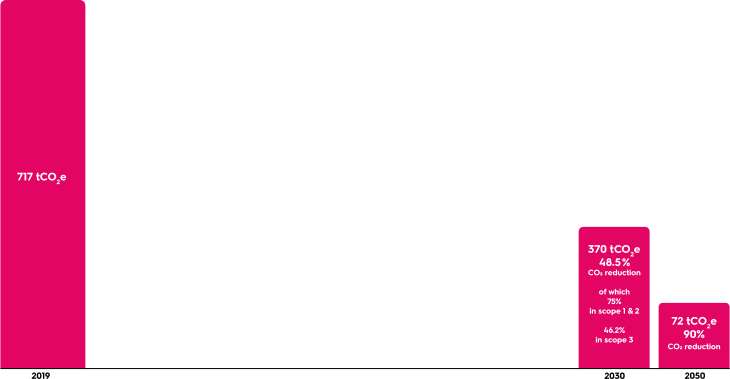
Scope 1 & 2: 75% reduction in emissions by 2030 compared with 2019
72,6%
Scope 3: 46.2% reduction in emissions by 2030 compared with 2019.
12,6%
policy
- Materials policy
- Ingredients policy
- Supplier policy
- CO2 reduction in the production chain

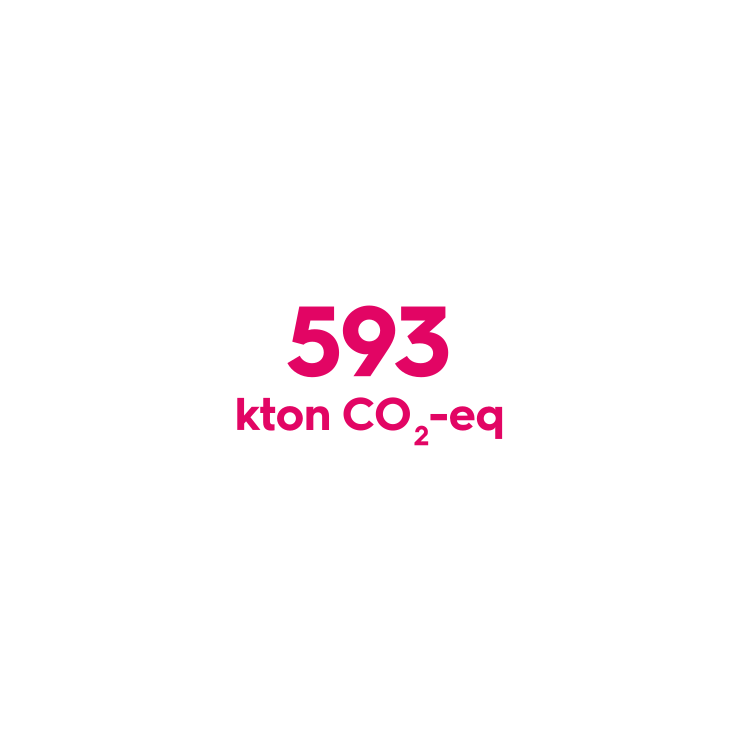
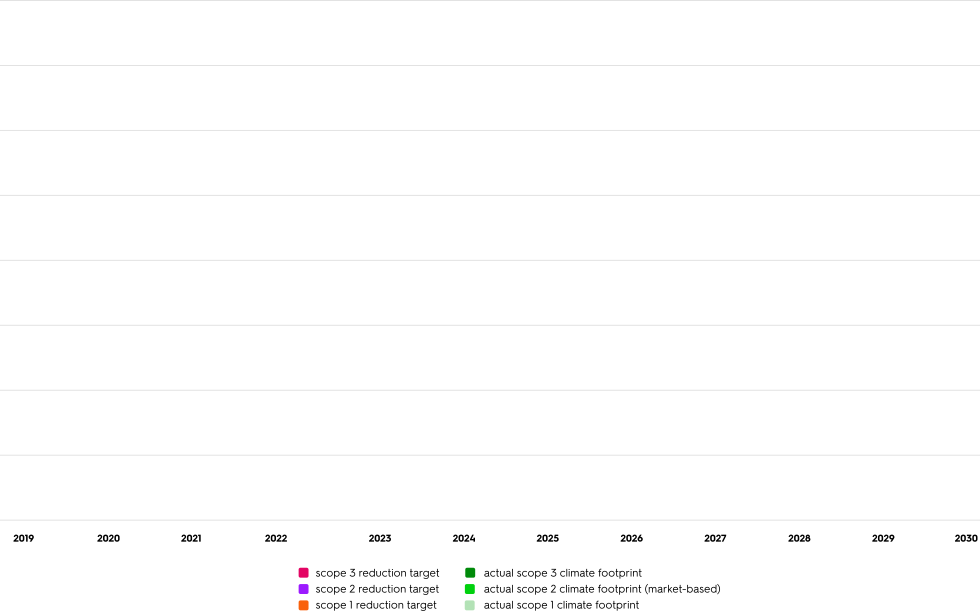
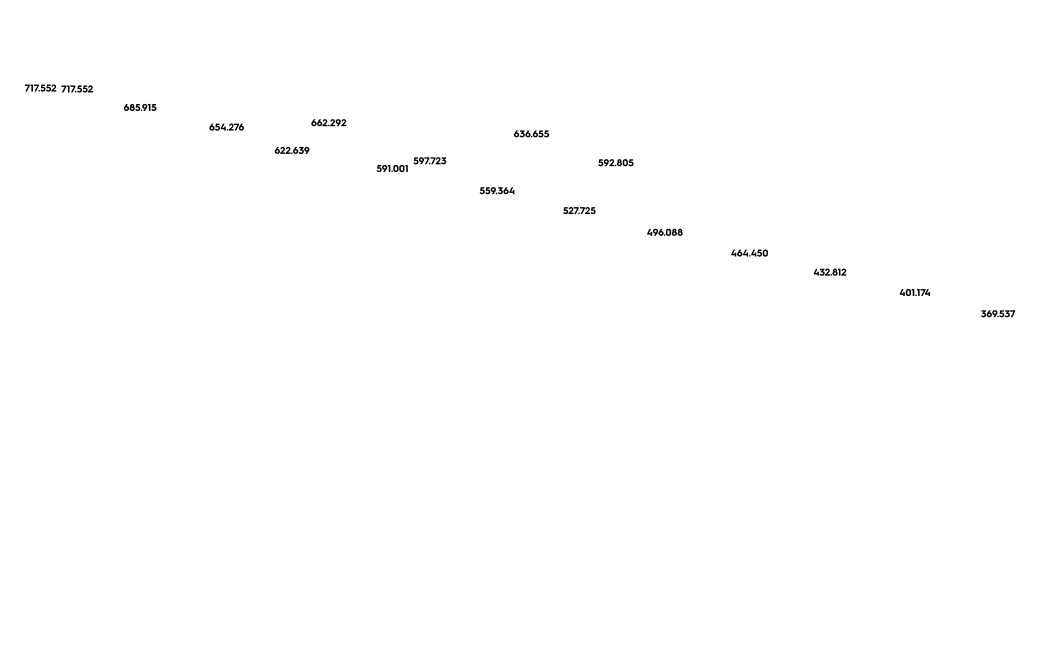
In 2025, HEMA’s total climate footprint stood at 592.8 kilotonnes of CO2-eq. Of this, 2.6% is attributable to our own operations (scope 1 and 2). The remaining 97.4% consists of indirect emissions within our value chain (scope 3), primarily arising from the production of purchased goods that we sell to our customers.
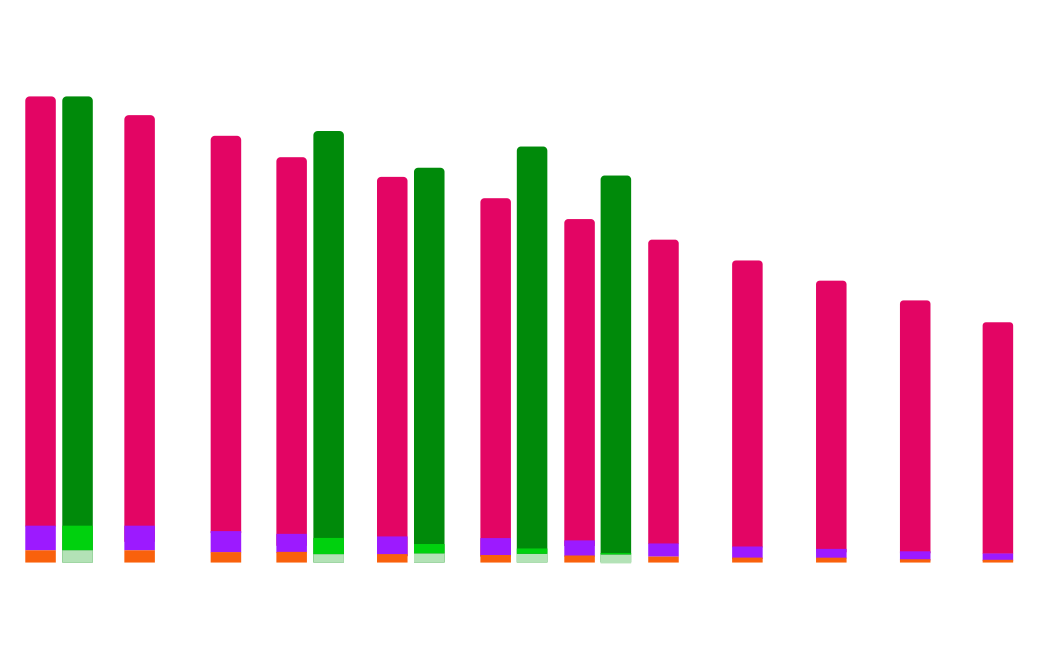
Compared with 2019, our total climate footprint has fallen by 17.3% in the period up to and including 2025, from 717 to 592.8 kilotonnes of CO2-eq.
2024: In 2024, we saw an increase in CO2 emissions, as we included energy consumption during production at the factories that supply HEMA. As a result, HEMA’s overall carbon footprint has increased, but without this addition, emissions per product have actually fallen. A sign that we are measuring more accurately and heading in the right direction.
2025: By 2025, CO2 emissions will have fallen compared with 2024, and also compared with 2023! We’re very proud of that.
This was mainly due to a number of steps:
- We have a new energy contract under which we source 100% wind energy for our Dutch shops.
- We have improved the quality of our data by adding quality marks to material data.
- We have sourced more sustainable materials
- We take into account not only the energy consumption of our plants, but also the energy mix (comprising both renewable and fossil fuels) of our 40 strategic plants, who together are responsible for 75% of the emissions from all our factories.
view distribution details
climate footprint in 2024 and 2025:
breakdown
| category | 2019 | 2022 | 2023 | 2024* | 2025* | % difference compared to 2019 |
|---|---|---|---|---|---|---|
| Scope 1 | 18.809 | 12.465 | 13.932 | 13.550 | 13.156 | -30% |
| 1.1 combustion in own buildings | 7.387 | 5.573 | 4.252 | 3.150 | 2.610 | -65% |
| 1.2 combustion of fuels in own means of transport | 4.900 | 3.384 | 3.042 | 2.225 | 2.096 | -57% |
| 1.3 other direct emissions (e.g. refrigerants) | 6.522 | 3.508 | 6.638 | 8.175 | 8.449 | +30% |
| Scope 2 (location-based) | 26.235 | 21.201 | 15.241 | 14.976 | 15.755 | -40% |
| 2.1 purchased electricity | 25.846 | 20.303 | 14.786 | 14.582 | 15.417 | -40% |
| 2.3 purchased heat | 274 | 897 | 456 | 394 | 338 | +23% |
| 2.4 purchased cooling | 115 | |||||
| Scope 2 (market-based) | 38.564 | 25.362 | 10.379 | 8.127 | 2.566 | -93% |
| 2.1 purchased electricity | 38.174 | 24.465 | 9.924 | 7.734 | 2.228 | -94% |
| 2.3 purchased heat | 274 | 897 | 456 | 394 | 338 | +23% |
| 2.4 purchased cooling | 116 | |||||
| Scope 3 | 660.179 | 624.465 | 572.925 | 614.978 | 577.084 | -13% |
| 3.1 purchased goods and services | 482.323 | 485.846 | 430.497 | 483.249 | 443.921 | -8% |
| 3.3 fuels or energy outside scopes 1 and 2 (market-based) | 7.718 | 6.521 | 4.668 | 2.235 | 2.026 | -74% |
| 3.4 transport and distribution in the supply chain | 15.092 | 17.663 | 15.981 | 19.827 | 19.723 | +31% |
| 3.5 waste processing | 4.028 | 3.521 | 3.996 | 5.017 | 4.752 | +18% |
| 3.6 business travel | 465 | 188 | 258 | 276 | 314 | -32% |
| 3.7 commuting | 12.250 | 12.415 | 5.187 | 6.200 | 5.842 | -52% |
| 3.11 use of products sold | 75.263 | 39.326 | 49.961 | 53.634 | 56.871 | -24% |
| 3.12 processing of sold products at end-of-life | 31.041 | 37.522 | 41.999 | 33.658 | 33.163 | +7% |
| 3.14 franchisees | 31.999 | 21.463 | 20.378 | 10.883 | 10.473 | -67% |
| Total market-based | 717.552 | 662.292 | 597.723 | 636.655 | 592.805 | -17% |
| Total location-based | 703.893 | 657.588 | 602.098 | 643.504 | 610.591 | -13% |
methodology and assumptions
* Data in 2024 and 2025 is presented based on the accounting policies and definitions described below, and is subject to a limited assurance engagement under NV COS 3000. We refer to page 118 for the auditor's Limited Assurance report.
We report our CO2 emissions from electricity consumption using both the location-based and market-based methods set out in the GHG Protocol. These are shown in the table. As HEMA’s SBTi targets have been set using the market-based approach, all CO2 figures published in this report are based on our market-based emissions.
The market-based method reports emissions based on the electricity actually purchased, as specified in contracts. Market-based emissions show the conscious choices we make to reduce our climate impact. By signing up to renewable energy contracts, we can actively reduce our carbon footprint.
The location-based method uses the average emission factor of the electricity grid in the country where the organisation operates, thereby showing the emissions theoretically associated with the consumption of the average electricity mix.
methodology and assumptions
HEMA uses the Greenhouse Gas (GHG) protocol and adheres to its guidelines. HEMA’s carbon footprint is calculated using the LCA method, which means that all emissions released throughout a product’s entire life cycle are taken into account. We do this in collaboration with our partner, Root Sustainability.
In the calculation of our carbon footprint, there are eight categories that are excluded:
- 1.4 Emissions from chemical or physical processes:
HEMA does not produce steel, cement or chemicals. - 2.2 Indirect emissions from steam:
HEMA does not purchase steam or heat from external suppliers, as it does not have any industrial facilities. - 3.2 Capital goods:
Capital goods are included in scope 3.1. - 3.8 Upstream leased assets:
The energy consumption of leased assets is included in scope 1 and 2 or in scope 3.1. - 3.9 Downstream transport and distribution:
All transport is included under scope 3.4. - 3.10 Processing of sold products:
HEMA products are finished goods and are therefore not processed further. - 3.13 Downstream leased assets:
HEMA does not lease out any assets. - 3.15 Investments:
HEMA has no significant investments in other companies.
scope 1 and 2
Our scope 1 and 2 emissions consist of the electricity and gas consumption of our shops, distribution centres and offices, the refrigerant consumption of our refrigeration systems, and the fuel consumption of our own transport fleet and our leased vehicles.
- Electricity and gas consumption figures for shops are based on billing data. If this is not available, we make an estimate based on the average consumption per square metre.
- Refrigerants, fuel consumption for our own transport, and the leased vehicle fleet are all based entirely on invoice data.
- We use emission factors from Ecoinvent 3.11 and CO2emissiefactoren.nl.
scope 3.1 Purchased goods and services
This covers all goods purchased by HEMA during the financial year, including MVA investments (capital goods). For the calculation, we use quantities, weights, the material composition and amounts.
The following assumptions were made in the calculation for 3.1:
- If a product’s material composition is unknown, a proxy is selected from a similar product whose composition is known.
- Operating and capital expenditure (opex and capex): each expenditure item is assigned a category, to which an impact reference is then linked. These categories account for 95% of expenditure; the remaining 5% is extrapolated.
The emission factors we have used are taken from the following sources: Ecoinvent version 11, Exiobase, Agrifootprint and specific EPDs.
scope 3.3 Fuel- and energy-related emissions not already included in scope 1 or 2
This refers to ‘upstream’ activities, such as the extraction, production, refining and transport of fuels to the fuel tank or the electricity grid. This refers to the emissions generated during the production of fuel and energy under scopes 1 and 2. The emission factors used for this purpose are sourced from CO2emissiefactoren.nl and Ecoinvent 3.11.
scope 3.4 Upstream and downstream transport
Upstream transport is measured in tonne-kilometres. This examines the route from the manufacturer to our distribution centre. The route is estimated based on the producer’s location and the seaport known to be used by that producer. Here, we look at the most common mode of transport for each producer. HEMA uses Ecoinvent 3.11 for its calculations.
Distribution to HEMA’s shops outside the Netherlands is handled by external transport companies. They share the distances they have cycled with us. For online orders, we receive data on the parcels delivered and emission factors from our carriers.
scope 3.5 Waste from own operations
When calculating waste generated by our own operations, we look at the bulk of the waste volume in kilograms. Missing data points are extrapolated. Projections are made on the basis of data from previous years, or (for shops) on the basis of kg/m²2. We use Ecoinvent 3.11 for the emission factors, broken down by waste stream and treatment method.
scope 3.6 Business travel
The impact of business travel is calculated based on distance in kilometres and mode of transport. The emission factors used for this are taken from Ecoinvent 3.11.
Scope 3.7 Employee commuting
The impact of commuting is based on an employee survey. This form asks for the distance and mode of transport. The data from this survey is extrapolated to make it applicable to all active employees. Emission factors from Ecoinvent 3.11 are used.
Scope 3.11 Use of products sold
During the usage phase of products sold, we take the following products into account:
- Textile products that are being washed. To work this out, we look at the number of washes and the lifespan of a product.
- Electrical products with a cord. We exclude battery-powered products from the scope, unless the product is rechargeable. To calculate the environmental impact, we look at the product’s lifespan and average annual energy consumption.
This is calculated on the basis of goods purchased. For both textile and electrical products, the lifespan has been determined on the basis of industry averages.
HEMA sells products in several countries. That is why we apply a sales breakdown by country. We use the country-specific location-based (average grid mix) emission factors from Ecoinvent 3.11.
Scope 3.12 Processing of products sold
The processing of sold products is calculated on the basis of the total weight purchased, the type of waste per main category, and customised factors. The customised factors have been derived from waste management data provided by the World Bank, Statista and Eurostat.
Scope 3.14 Franchises
The electricity and gas consumption of HEMA’s franchise shops has been extrapolated based on measurement data from 2024. For the emission factors, we use the average energy mix from CO2 emission factors.
our climate footprint in focus
2019-2030
view scope 1 & 2: own operations

scope 3 emissions in 2025, compared to 2019, have decreased by
30%
13,2 kton CO2-eq
for example, gas consumption, fuel consumption of trucks
scope 3 emissions in 2025, compared to 2019, have decreased by
93,4%
2,2 kton CO2-eq
for example, electricity consumption in shops
our climate footprint for 2024 and 2025
scope 1 & 2
own operations
Running our own business takes a lot of energy. We heat and light our shops, keep products cool and transport goods from our distribution centres to our branches.
Our scope 1 emissions fell by 30% in 2025 compared with 2019, to 13.2 ktonnes of CO2-eq. These are all direct greenhouse gas emissions resulting from the combustion of gas and fossil fuels within our own operations. The majority of these emissions are caused by gas consumption for heating shops, refrigerant consumption by refrigeration systems, and fuel consumption by our lorries.
By 2025, scope 2 emissions had fallen by 93% compared with 2019, to 2.6 kilotonnes of
CO2-eq. This includes all indirect emissions resulting from the consumption of purchased energy, such as electricity, district heating and cooling. Electricity consumption in our shops is the biggest source of emissions. From 2025, we will be sourcing 100% European wind energy for our own offices in the Netherlands. In addition, our entire fleet of passenger cars in the Netherlands will be electric by 2025.
view scope 3: value chain
scope 3 emissions in 2025, compared to 2019, have decreased by
13%
577,2 kton CO2-eq
for example, the production of items we purchase and their energy consumption during the customer's use phase
our climate footprint for 2024 and 2025
scope 3
value chain
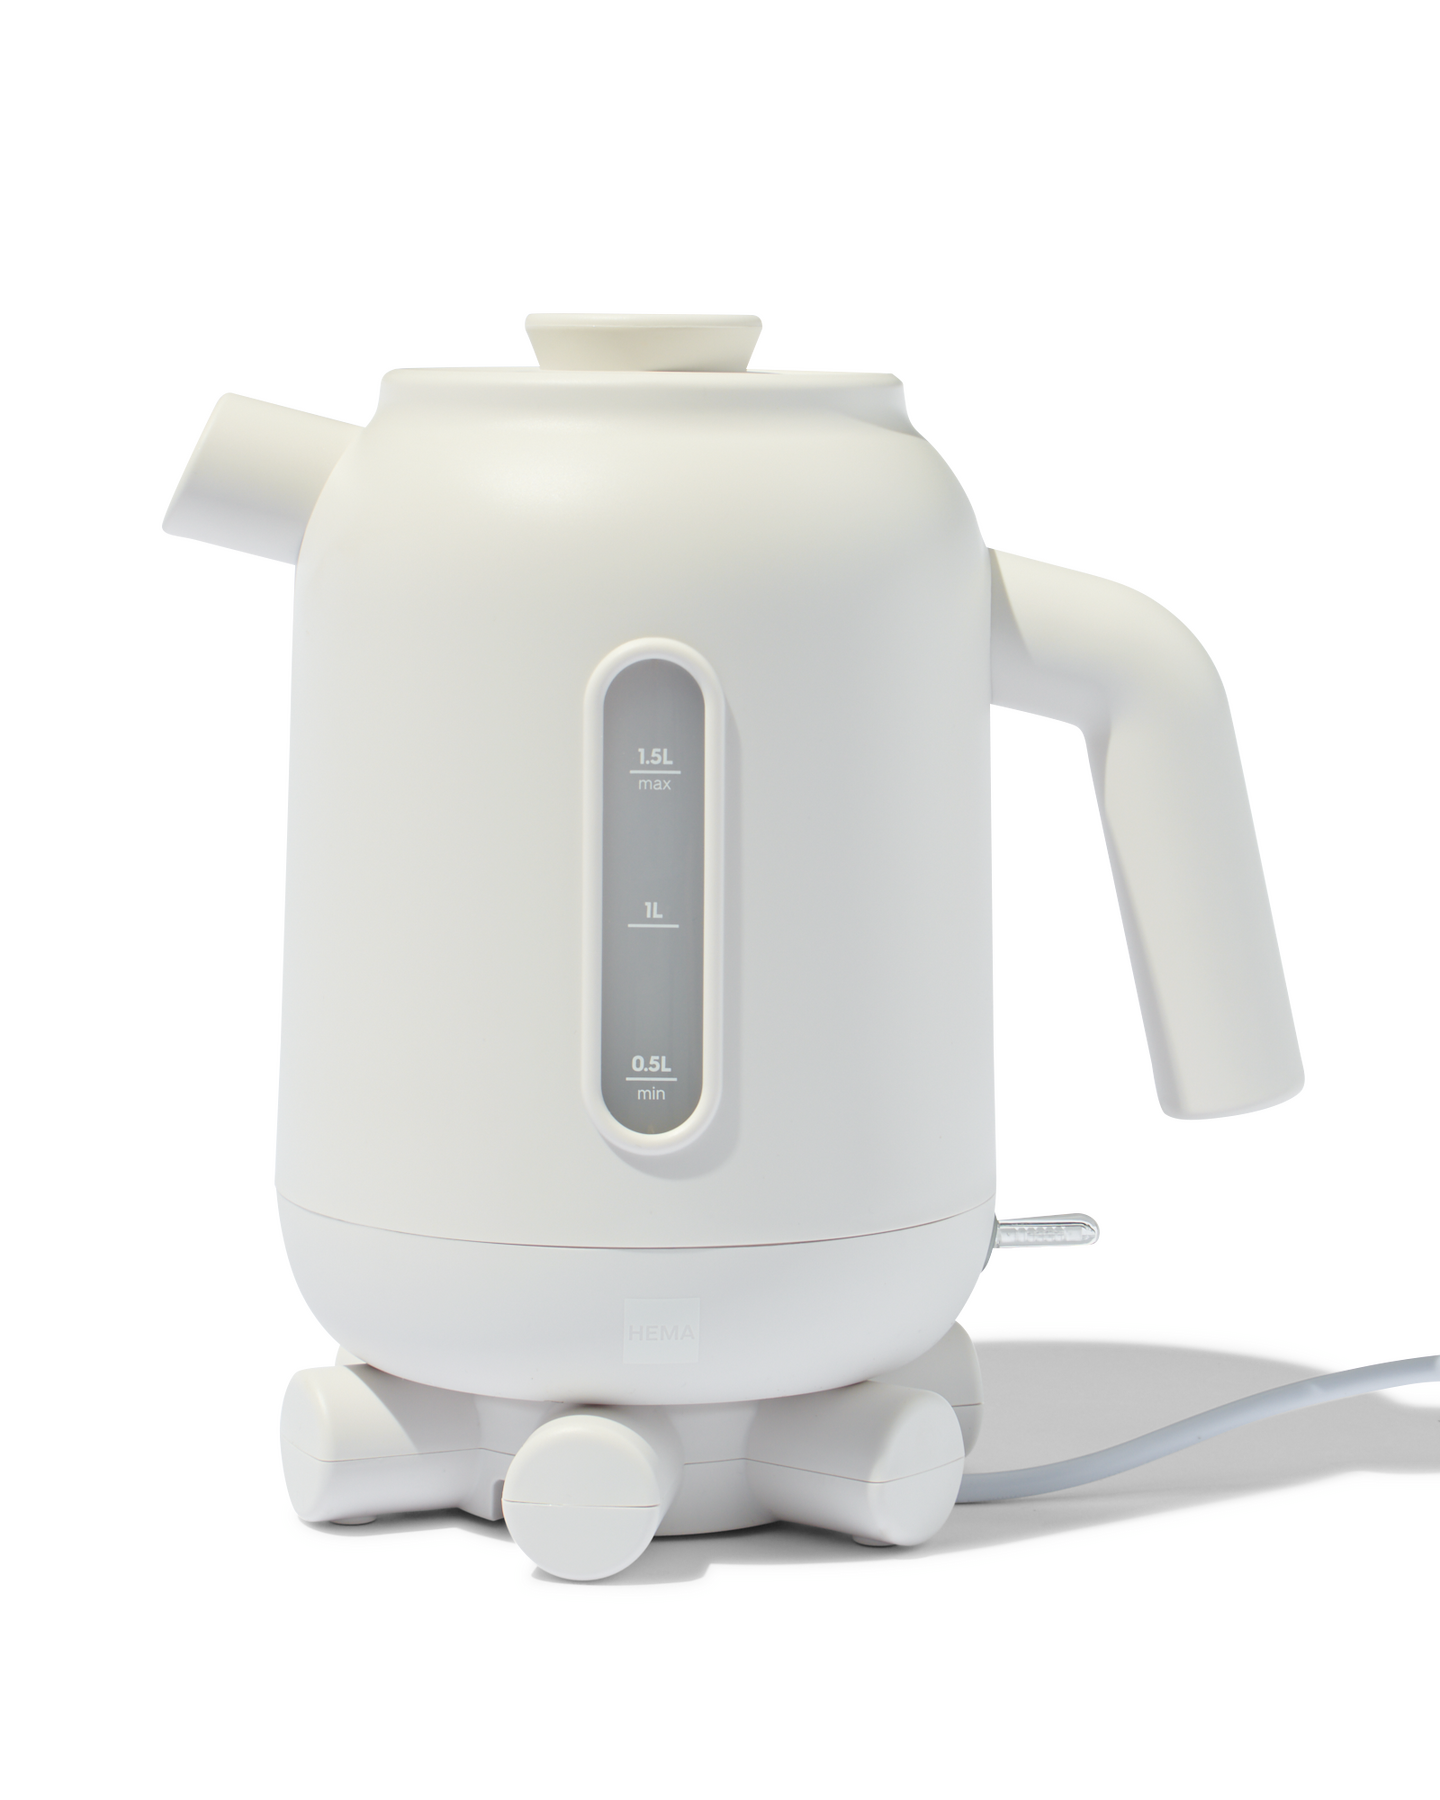
Scope 3 covers all indirect CO2 emissions within our value chain, such as the extraction of raw materials, the production of our products, transport from factories to our distribution centres, employees’ commutes, business travel and waste disposal. We also take into account the energy consumption by customers when using our products, such as boiling water with our kettle.
Between 2019 and 2025, total scope 3 emissions fell by 13%, from 660 ktonnes to 577 ktonnes of CO2-eq.
The majority of our scope 3 emissions come from category 3.1: purchased goods and services, accounting for 74.9% of our total climate footprint. Given the large volume of products we purchase and the fact that product manufacturing (from the extraction of raw materials to assembly) has the greatest impact, this is the largest category within our overall climate footprint.
E1-2
policy
Our climate policy is underpinned by our reduction levers: the measures that have the greatest impact on the structural reduction of our emissions. The policy translates strategic ambitions into concrete guidelines and actions, and focuses on both the company’s own operations (scope 1 & 2) and the value chain (scope 3).
E1 SBM-3
climate strategy
We follow the scientific guidelines of the Science Based Targets initiative (SBTi) and have scientifically validated targets for 2030 and 2050. These targets are in line with the Paris Agreement, which aims to limit global warming to well below 2°C.
“We used to work with averages a lot. We can now see, for each product and each factory, where the greatest impact lies. That makes our approach to reducing emissions much more targeted,”
Fuusje Schlette, responsible for calculating our carbon footprint at HEMA.
E1-4
climate transition plan
indirect impact in the value chain
- Reducing emissions in production processes
- Reducing emissions in other areas of business operations, such as waste and transport
direct impact on the value chain
- Increase in recycled material
- Increase in plant-based ingredients
- Increase in use of materials/ingredients with quality marks
included in our own activities
- Procurement of renewable energy
- Improving energy efficiency
E1-3
actions
Our strategy for reducing CO2 emissions is built around five reduction levers: specific actions we take to make a difference. Each lever focuses on a specific aspect of our business operations and value chain: from energy consumption in our own operations to product development and collaboration with suppliers.
1
lever 1
transition to renewable energy in our own operations (scope 1 & 2)
windenergie
lever 1
transition to renewable energy in our own operations (scope 1 & 2)
Our shops, distribution centres and offices use energy for lighting, heating, cooling and logistics. To reduce these emissions, we are committed to the transition to renewable energy sources:
- We install solar panels on the roofs of buildings where this is technically and economically feasible. This allows us to generate sustainable energy locally and reduce our reliance on the electricity grid.
- At as many sites as possible, we are switching to 100% renewable electricity, so that our energy supply comes from renewable sources.
- We use biofuel (HVO30) for transport from our distribution centres to our shops. Our aim is to switch to electric lorries. We are currently looking into the options available.
2025: In the Netherlands, all our own shops have switched to 100% wind energy. In addition, over the past year we have completely switched to a fleet consisting entirely of 100%* electric passenger cars. Last year, this figure stood at 97.4%.
* Data in 2025 is presented based on the accounting policies and definitions described below, and is subject to a limited assurance engagement under NV COS 3000. We refer to page 118 for the auditor's Limited Assurance report.
methodology and assumptions
On reference date 1 February 2026, an export was made of all driving passenger cars in HEMA Netherlands' leased car fleet. The total fleet of leased cars in the Netherlands on the reference date consists of 78 cars. Only fully electric passenger cars are classified as electric.
lever 2
saving energy and working more efficiently in our operations
(scope 1 & 2)
wagenpark
2
lever 2
saving energy and working more efficiently in our operations (scope 1 & 2)
As well as switching to renewable energy, we are focusing on reducing our energy consumption. By working smarter and more efficiently, we are further reducing our CO₂ emissions:
- We are replacing existing lighting with energy-efficient LED lighting, improving the insulation of buildings and optimising heating, ventilation and air-conditioning (HVAC) systems.
- In our shops, we use automatic sliding doors to minimise heat loss and energy-efficient refrigeration systems for our products.
- We are introducing smart meters and energy monitoring systems so that we can gain immediate insight into our energy consumption. This enables us to identify and address inefficiencies more quickly.
- We are implementing cost-saving measures from the RVO’s list of approved measures.
- In our shops, offices and distribution centres, we are implementing energy efficiency programmes aimed at optimising energy-intensive systems and processes.
lever 3
reducing indirect emissions in our products – materials and ingredients
(scope 3)
denim
3
lever 3
reducing indirect emissions in our products – materials and ingredients (scope 3)
The largest source of our scope 3 emissions is the products we purchase and sell. It is the materials and ingredients in particular that determine the environmental impact. That is why we are implementing (where possible) more sustainable product design and use of materials:
- We are increasing the proportion of recycled materials in our textiles and hardware, and are increasingly using materials with a lower carbon footprint.
- We are reducing our use of packaging materials by designing more intelligently and opting for packaging that is recyclable or reusable.
2025: For a large proportion of our denim, we are taking a significant step forward: from now on, we will use at least 20% pre-consumer recycled yarn. This way, we give valuable materials a new lease of life, without compromising on quality. This is how we reduce the environmental impact of our denim, whilst ensuring it lasts just as long as you’ve come to expect from us. These items will be available in shops from 2026 and 2027.
lever 4
reducing indirect emissions in production processes at our manufacturing sites (scope 3)
BEPI
4
lever 4
reducing indirect emissions in production processes at our manufacturing sites (scope 3)
To reduce our overall environmental impact, we are working with suppliers to make their production processes more sustainable:
- We have a responsible procurement policy, through which we encourage suppliers to improve their environmental performance.
- We use the amfori platform to collect data from our production sites on, among other things, energy consumption, energy sources, water consumption, waste streams and recycling. Using this information, we identify where the majority of emissions occur within our supply chain and work with suppliers to achieve CO2 reductions.
- We work with suppliers to achieve CO2 reductions. We do this by engaging in dialogue, agreeing on objectives together, and learning how we can support suppliers.
2025: By 2025, we will have actively collected data from our production sites on energy consumption, energy sources, water consumption, waste streams and recycling through BEPI audits. This data gave us a quick insight into where the highest CO₂ emissions in our production chain are and which suppliers have the greatest impact, enabling us to set specific priorities in collaboration with them. In 2026, we will be holding discussions with these suppliers to jointly explore specific measures for improvement, such as more efficient energy use, more sustainable energy sources and smarter waste and water management. We want to work with our suppliers to share more knowledge and set up initiatives to reduce CO₂ emissions in our supply chain, step by step.
“We don’t claim to have all the answers.” It really is a partnership between us and the supplier. They have such a wealth of knowledge about their production processes. “We can then look together at what is feasible,”
Fuusje Schlette
lever 5
reducing indirect emissions in other areas of our business operations (scope 3)
swill (gft)
5
lever 5
reducing indirect emissions in other areas of our business operations (scope 3)
In addition to category 3.1, scope 3 emissions include indirect emissions from property, transport and employee mobility. These emissions call for targeted measures to reduce energy consumption and make processes more sustainable, both upstream and downstream.
- We optimise routes, load lorries more efficiently and are increasingly using more sustainable fuels.
- We are reducing (residual) waste, partly by minimising wastage in shops as much as possible and by improving waste separation so that a higher percentage can be recycled.
- We are looking into ways of encouraging more sustainable commuting.
2025: In 2025, we began preparations for the separate collection of organic waste (swill) and past-their-best products from shops, with the roll-out scheduled for 2026. By collecting these waste streams separately, we can make better use of them and process them sustainably, rather than letting them end up in the general waste. In this way, we reduce the amount of residual waste that is incinerated and help to reduce scope 3 emissions.
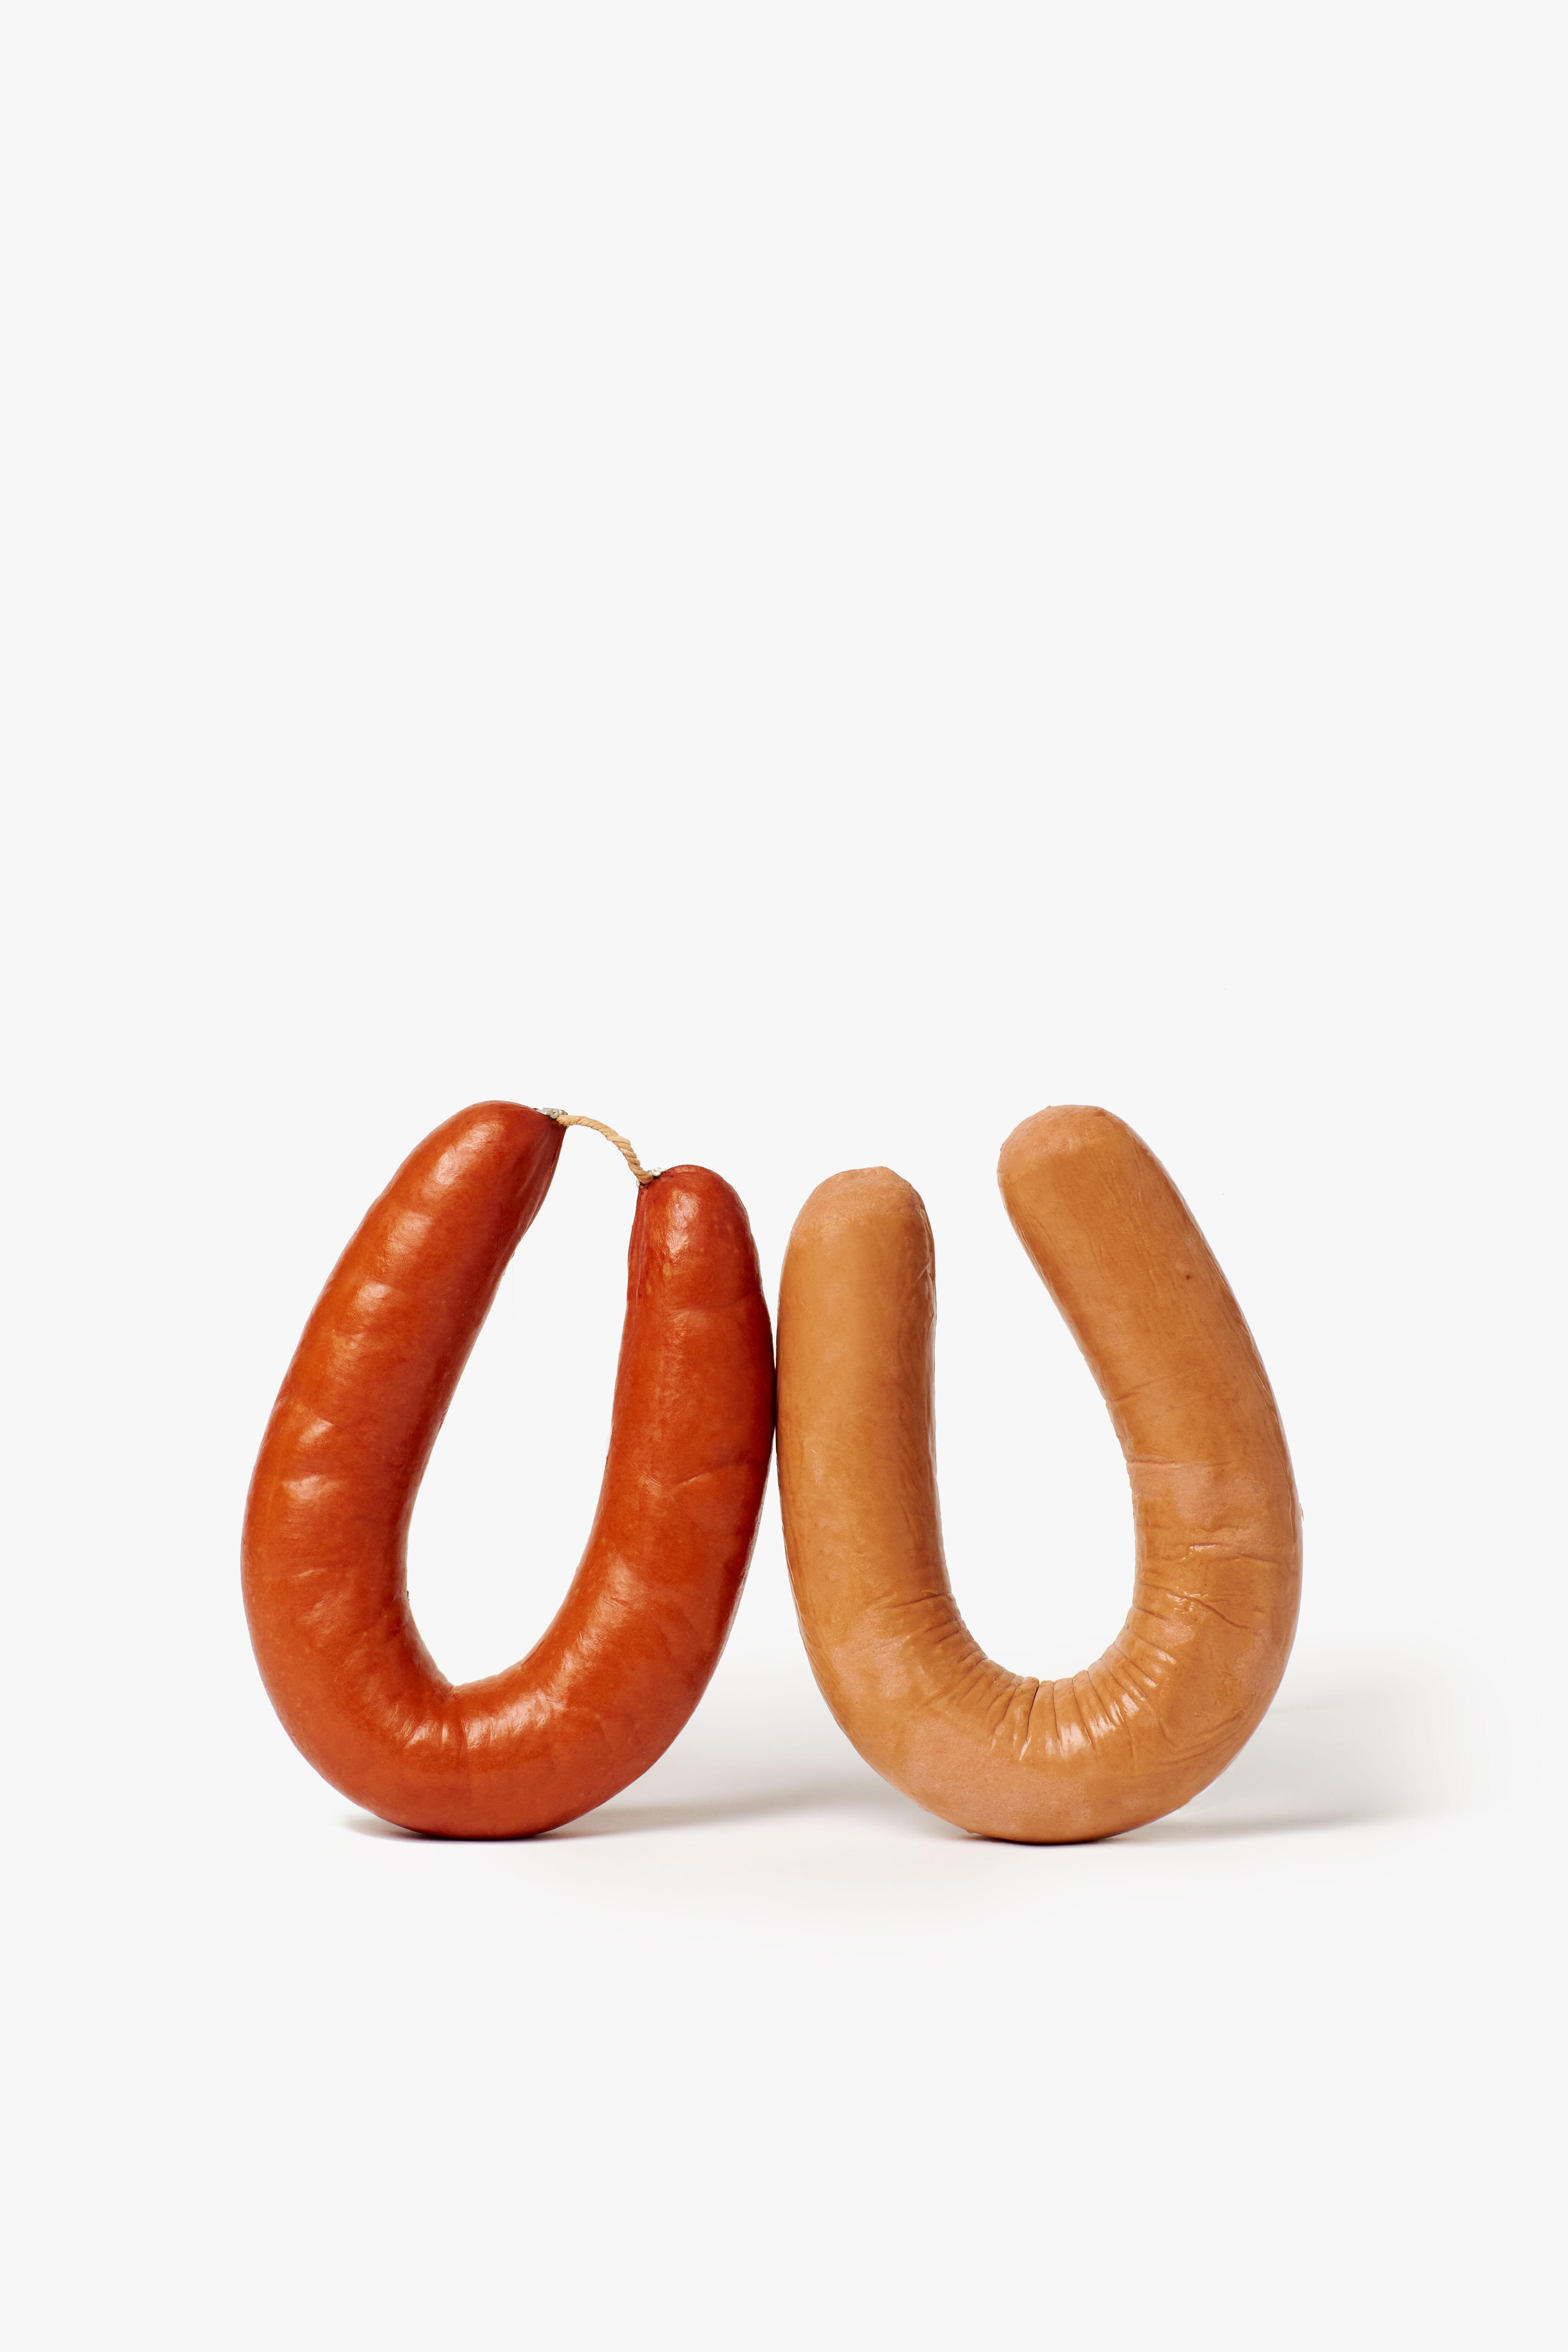
rookworst (smoked sausage) and ookworst 2.0 (vegetarian smoked sausage)
tradition meets innovation
At HEMA, we are celebrating 100 years of entrepreneurship and our close relationship with our customers. In 2025, we will demonstrate that tradition and innovation can go hand in hand. Our iconic smoked sausage continues to offer the familiar flavour that the Dutch have enjoyed for generations, whilst at the same time we are taking a major step forward with our fully plant-based smoked sausage.

rookworst (smoked sausage) and ookworst 2.0 (vegetarian smoked sausage)
new vegetarian sausage: entirely plant-based
The decision to make the smoked sausage entirely plant-based was a straightforward one: we wanted a smoked sausage that everyone could enjoy. From plant-based food lovers and flexitarians to those with a dairy allergy: everyone can now enjoy the distinctive crunch, juiciness and smoky flavour that make our smoked sausage so unique. The biggest challenge was the ‘casing’, which previously contained animal proteins. Together with our supplier, we have replaced this with a plant-based alternative. We’re now confident enough to say that we have the best plant-based smoked sausage on the market! Feedback from customers, ranging from enthusiastic reviews to posts on social media, confirms that we have succeeded in this.
The classic HEMA smoked sausage is once again being made according to the original recipe
In 2024, HEMA switched to a different supplier in order to comply with the Beter Leven quality mark. This altered the distinctive HEMA flavour, which not all customers recognised. That is why we have decided to bring back the classic smoked sausage, whilst retaining the Beter Leven 1-star quality mark. Thanks to careful choices throughout the supply chain, traditional preparation methods and close collaboration with our supplier. We also offer our organic smoked sausage, which has been awarded a 3-star Beter Leven rating.
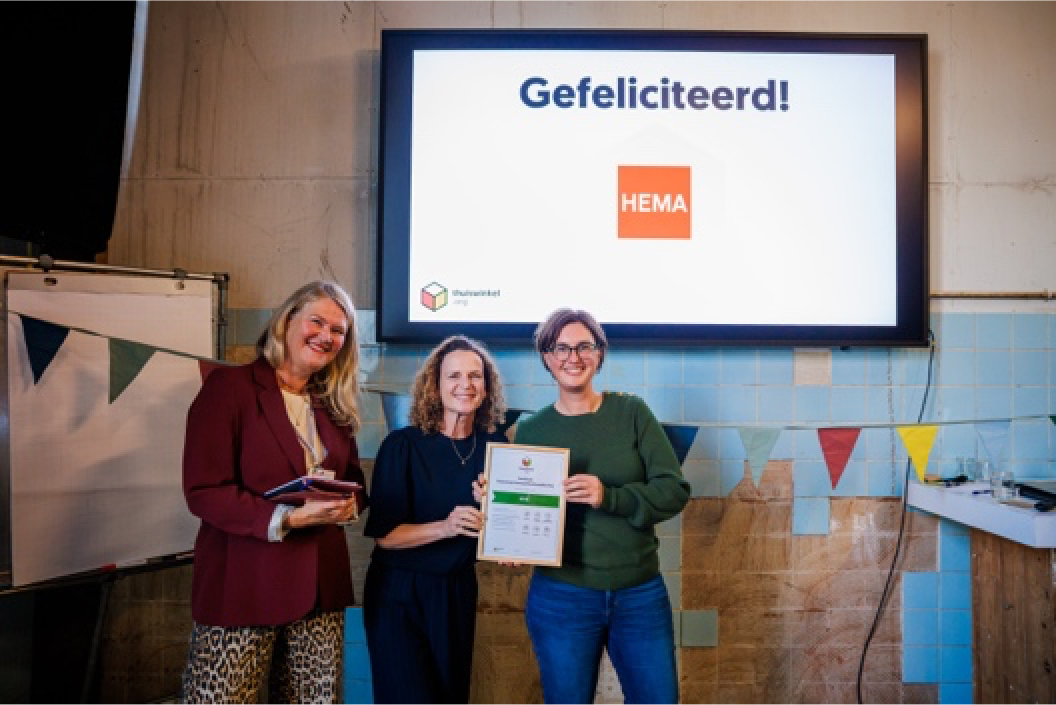
HEMA has been awarded the Thuiswinkel Sustainability Certification
Since 2025, our online shop has been certified with the Thuiswinkel Sustainability Certificate. Our online platform has therefore been independently assessed across six sustainability themes: strategy, the circular economy, product range, packaging, delivery and returns.
HEMA has been awarded the Thuiswinkel Sustainability Certification
Since 2025, our online shop has been certified with the Thuiswinkel Sustainability Certificate. Our online platform has therefore been independently assessed across six sustainability themes: strategy, the circular economy, product range, packaging, delivery and returns.
Various teams worked closely together throughout the certification process. Colleagues at the EDC (e-commerce distribution centre) provided insights into our packaging and dispatch processes; packaging specialists analysed how much ‘air’ we transport; the sustainability team contributed input on products, quality marks and circularity; and the customer service team provided additional information pages. That’s how all the pieces of the puzzle fell into place, drawing on a range of expertise.
This certification is a great recognition for colleagues who have been committed to more sustainable processes, products and choices for many years. At the same time, the process acted as a catalyst: it confirmed what we were already doing well and brought new insights and awareness to the organisation.
We therefore carried out an in-depth study into the use of bicycle couriers. Although the ‘last mile’ by bike is sustainable, it appears that non-sustainable lorries are often still used for the ‘first mile’, from the EDC to the first delivery hub. The overall savings from introducing the bicycle courier are therefore less significant than they might appear at first glance. By asking critical questions about the entire supply chain, we also engaged in discussions with our regular shipping partner, DHL, about their approach. Thanks to their scale, they are actually taking significant steps towards making the first mile more sustainable and are incorporating bicycle couriers where this proves beneficial.
The process was therefore not only reaffirming, but above all instructive and inspiring. It challenged us to look beyond what appears sustainable at first glance and to make increasingly well-informed choices.
“First and foremost, I am proud of the fact that our extensive network of shops contributes to our low return rate, which is well below the norm. 91% of all returns are processed in shops, without the need for additional packaging or extra transport. The products can be sold there straight away. This shows that an omnichannel player can really have an edge when it comes to sustainability.
We have also been proud of the efficiency of our automated EDC for many years. It turns out that this also means we use packaging materials very efficiently: no filler material and hardly any air being transported. In fact, we are already well ahead of legislation that does not come into force until 2030. “That feels like a great head start,” said Karlijn van den Berg (e-commerce manager).
E1 SBM-3
climate adaptation
The consequences of climate change are posing ever-greater physical risks to HEMA’s business operations and value chain. Extreme weather, heatwaves, water stress and flooding are becoming more frequent and unpredictable. This has a direct impact on the continuity of our shops, as well as on production sites within our supply chain and the availability of raw materials. The rise in coffee prices due to poor harvests caused by climate change is a good example of this. In addition, disruptions to transport and logistics may occur more frequently, for example when severe storms or flooding render ports, roads or rail links temporarily unusable. Geopolitical tensions can also disrupt key trade routes, leading to delays in the supply of goods and, ultimately, to empty shelves.
E1-2 E1-3 E1-4
our objectives, initiatives and policies
Our aim is to systematically identify climate risks within both our own operations and the supply chain, and to develop targeted adaptation plans to address them.
We expect to have identified the key climate risks and drawn up the corresponding adaptation plans by 2026.
In 2027 we will integrate these plans into our business operations and make climate adaptation a standard part of our due diligence cycle.
nature
E2/3/4 IRO-1
our material impacts, risks and opportunities
The products we make and the raw materials we use account for the lion’s share of our environmental impact, including our impact on nature. That is why we are working to gain a better understanding of that impact. We analyse where nature is under pressure within our supply chain, which raw materials pose the greatest risks, and where our actions can have the greatest impact.
In 2025, we will assess our impact on nature using Spirefly, a platform aligned with international frameworks such as Science Based Targets on Nature (SBTN) and the Taskforce on Nature-related Financial Disclosures, thereby ensuring our nature strategy is aligned with the best available science.
read more about our impact
our material impacts, risks and opportunities
Onze impact op natuur en milieu analyseren we vanuit twee invalshoeken: impacts en risico’s.
We calculate the environmental impact of our products using impact factors from the Ecoinvent database, in the same way that we determine our CO2 impact. Here, we are looking at the following impacts: land use, soil pollution, water use and water pollution.
By combining impact and risk, we gain a better understanding of where the greatest pressure on nature lies and where we should focus our efforts.
We carried out an initial pilot survey in 2023. For the 2025 survey, we have significantly broadened our scope. We now include our hardware as well; we have a better understanding of where our ingredients come from, and we know the composition of our products much more precisely. Thanks to these improvements, the new assessment provides a more comprehensive picture of our impact on the natural world.
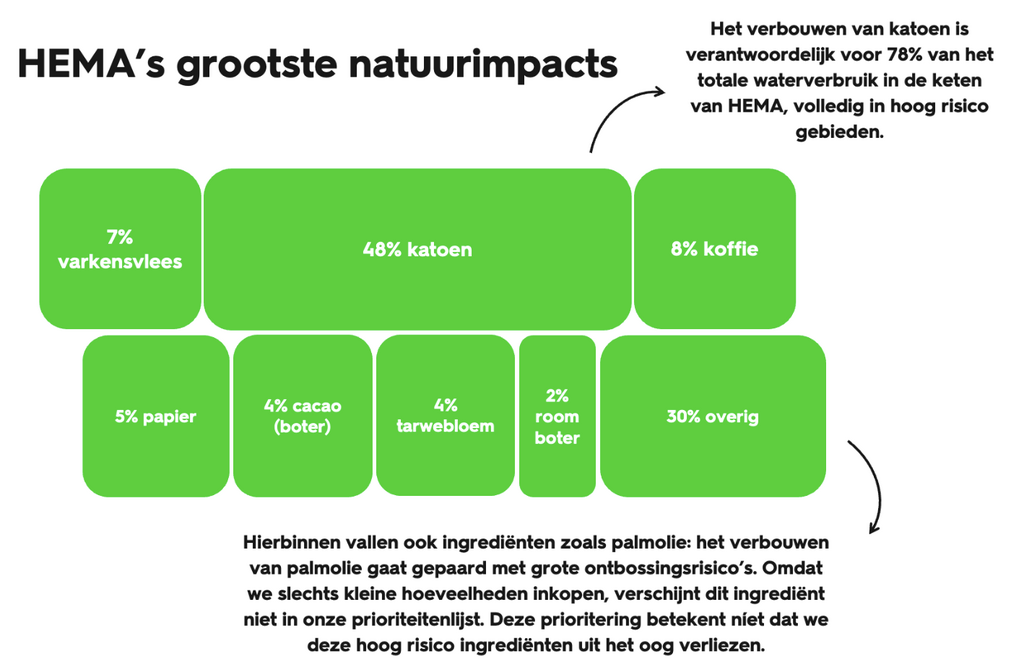
Based on our analysis of our impacts and risks to nature and the environment (land degradation, deforestation, soil contamination, water scarcity and water consumption), we see that our priorities, amongst others, lie with the following raw materials:
- Cotton: Growing cotton requires a lot of water.Cotton cultivation is therefore responsible for 78% of total water consumption in HEMA’s supply chain.This is despite the fact that a large proportion of cotton production takes place in areas where water scarcity is a problem.
- Coffee and cocoa: Coffee and cocoa come from areas at high risk of deforestation.The expansion of coffee plantations can therefore lead to the loss of forest and biodiversity, particularly if cultivation is not managed sustainably.Around 15% of the land used in HEMA’s supply chain is used for growing coffee and cocoa, making these raw materials a priority.
- Pork: Our pork comes from Europe. In countries such as the Netherlands, France and Germany, soil quality is under pressure, partly due to an excess of nutrients in the soil. Pig manure can contribute to this.
In addition, pigs require a lot of feed, such as soya. The cultivation of soya requires large areas of farmland and takes place partly in regions with a high risk of deforestation. - Paper: Paper comes from forests. If these are not managed responsibly, we run the risk of deforestation.
As the greatest environmental impact arises during the production of materials and ingredients, this is also where our greatest opportunity for improvement lies. This is why we are increasingly making a conscious choice to use materials that have a reduced environmental impact during the production phase. Take, for example, the use of recycled cotton; this reduces the environmental impact as less new cotton needs to be grown. Another example is purchasing paper bearing the Forest Stewardship Council (FSC) quality mark. This quality mark prohibits deforestation of valuable natural areas and sets out requirements for the responsible management of forests. For example, the harvest focuses on what has grown naturally, and new trees are planted after existing ones have been felled. We are currently looking into what we can do to reduce our environmental impact in the coming years.
We assess the HEMA product range across five categories of impacts and risks:
land degradation
deforestation
soil contamination
water scarcity
water pollution
KPIs and objectives
E234
nature
IRO
topic
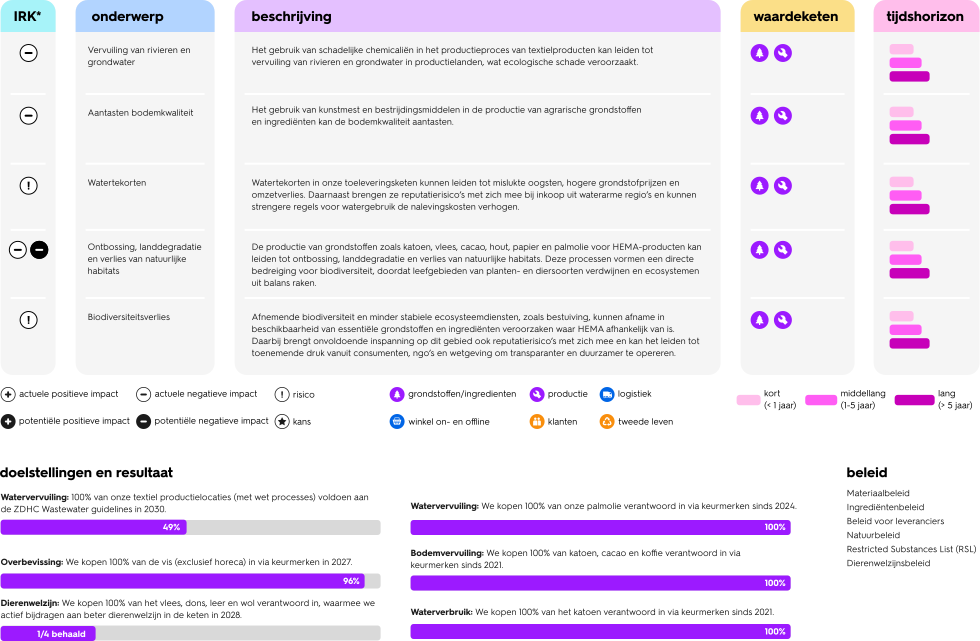
Pollution of rivers and groundwater
Deterioration of soil quality
Water shortages
Deforestation, land degradation and loss of natural habitats
Loss of biodiversity
description
Use of harmful chemicals in the manufacturing process of textile products can lead to the pollution of rivers and groundwater in the countries where they are produced, causing environmental damage.
Use of artificial fertilisers and pesticides in the production of agricultural raw materials and ingredients can damage soil quality.
Water shortages in our supply chain can lead to crop failures, higher raw material prices and a loss of revenue. In addition, sourcing from water-scarce regions carries reputational risks, and stricter regulations on water use could increase compliance costs.
The production of raw materials such as cotton, meat, cocoa, timber, paper and palm oil for HEMA products can lead to deforestation, land degradation and the loss of natural habitats. These processes pose a direct threat to biodiversity, as the habitats of plant and animal species are disappearing and ecosystems are becoming unbalanced.
Declining biodiversity and less stable ecosystem services, such as pollination, could lead to a reduction in the availability of essential raw materials and ingredients on which HEMA relies. Furthermore, a lack of effort in this area also entails reputational risks and can lead to increasing pressure from consumers, NGOs and legislation to operate in a more transparent and sustainable manner.
value chain
time horizon
current positive impact
current negative impact
risk
potential positive impact
potential negative impact
opportunity
raw materials/ingredients
production
logistics
online and offline store
customers
second life
short
(< 1 year)
medium
(1-5 year)
long (> 5 year)
objectives and results
Water pollution: 100% of our textile production sites (involving wet processes) will comply with the ZDHC Wastewater Guidelines by 2030.
49%
Water pollution: Since 2024, we have been sourcing 100% of our palm oil responsibly through quality marks.
100%
Overfishing: By 2027, we will source 100% of our fish (excluding the hospitality sector) through quality marks.
96%
Soil pollution: Since 2021, we have been sourcing 100% of our cotton, cocoa and coffee responsibly through quality marks.
100%
Animal welfare: We source 100% of our meat, down, leather and wool responsibly, thereby actively contributing to improved animal welfare throughout the supply chain by 2028.
1/4 achieved
Water consumption: Since 2021, we have been sourcing 100% of our cotton responsibly through quality marks.
100%
policy
- Materials policy
- Ingredients policy
- Supplier policy
- Nature policy
- Restricted Substances List (RSL)
- Animal welfare policy
E2/3/4-1
policy
Our nature policy covers the entire value chain. We are examining the impact of raw material production, suppliers and the usage phases, as these processes place pressure on ecosystems. To manage this effectively, we adopt a targeted approach that focuses on the key levers for limiting the loss of nature and promoting its recovery.
environmental policy
In addition to the materials policy, ingredients policy and environmental requirements for suppliers described above, we have set out our nature policy in the following policy documents:
In our environmental policy, we describe how we treat the natural environment with care in the areas where our products and raw materials are sourced. We outline our priorities regarding our impact on ecosystems, biodiversity and raw materials, and the measures we are taking to prevent and minimise this impact and, where possible, make a positive contribution. We use the SBTN Action Framework (AR3T: avoid, reduce, restore, regenerate, transform) as a guide to inform our actions and decisions.
Our Restricted Substances List (RSL) provides guidelines for the safe use of chemicals in products. The aim is to protect human health and the environment by preventing the use of harmful substances. The list is based on international legislation, such as REACH, and industry best practices. HEMA monitors compliance with this policy through regular audits of suppliers and product testing. The RSL applies to all HEMA products.
Our animal welfare policy focuses on treating animals with respect and minimising the negative impact of animal products. The policy is based on the ‘five-domain’ model, which aligns with the five freedoms of animal welfare and guides efforts to both reduce negative experiences and promote positive ones.
Later in this chapter, we will explain the quality marks that contribute to animal welfare, such as RWS and RMS (for merino and mohair wool). This policy applies to all animal-derived ingredients and materials used by HEMA.
quality marks
Making better choices is what we’re all about. Certificates and quality marks play an important role in this. Whether it’s ingredients or materials. We feel it is important to talk about this.
Quality marks and labels help us make clear agreements on environmental impact and animal welfare. Think of quality marks such as the Roundtable on Sustainable Palm Oil (RSPO) for palm oil, the Beter Leven quality mark (BLK) for meat, or FSC for wood and paper. This allows us to improve our impact in a reliable and measurable way.
View the certificates, specifications and quality marks we use on our website.
* Data in 2024 is gepresenteerd op basis van de accounting policies en definities hieronder beschreven en is onderhevig aan een limited assurance opdracht op basis van NV COS 3000. We verwijzen naar pagina X voor het Limited Assurance rapport van de accountant.
methodologie en aannames
De periode betreft aan HEMA geleverde producten in het financiële jaar 2024, dat liep van 29 januari 2024 tot en met 2 februari 2025. In de scope zijn alleen HEMA eigen merkproducten opgenomen. Daarnaast is er enkel gekeken naar de houdbare en verse producten die verkocht worden in de winkel, producten die in onze restaurants, takeaways en op onze gebaksafdeling worden verkocht zijn niet meegenomen. Voor koffie en thee zijn de warme dranken meegenomen, dus bijvoorbeeld niet de paaseitjes met koffie-extract. Aan de aantallen geleverde producten zijn de totaalgewichten per product uit het voedselspecificatiesysteem gekoppeld om tot een totaalgewicht te komen van de geleverde producten.
Voor cacao zijn alle producten die cacao als ingrediënt bevatten meegenomen. Hierbij is gekeken naar het gewicht van de cacao ingrediënten in deze producten.
Rainforest Alliance, Fairtrade en biologisch zijn keurmerken die door een onafhankelijke partij zijn gecertificeerd. Dit zijn de enige keurmerken die HEMA accepteert voor koffie, thee en cacao.
Tony’s open Chain is een initiatief dat streeft naar een transparante cacaoketen, waar boeren een eerlijke prijs ontvangen voor hun cacao.
lorem ipsum een aantal voorbeelden
lorem ipsum een aantal voorbeelden
lorem ipsum een aantal voorbeelden
lorem ipsum een aantal voorbeelden
lorem ipsum een aantal voorbeelden
lorem ipsum een aantal voorbeelden
lorem ipsum een aantal voorbeelden
food
2024
2025
cacao
Fairtrade of Rainforest Alliance
99.3%
100%
cacao
Purchased via Tony’s Open Chain
24%
32%
tea
Fairtrade
100%
100%
coffee
Fairtrade or Rainforest Alliance
100%
100%
palm oil
RSPO
99.8%
100%
meat
Organic or Beter Leven
63%
99%
fresh dairy products
Organic or Pasture
96%
95%
fish
MSC or ASC
93%
96%
soy
ProTerra
-
11%
keurmerken
food
By 2025, 100%* of HEMA’s own-brand coffee, tea and cocoa products (supplied in the 2025 financial year) will carry a Rainforest Alliance, Fairtrade or Organic quality mark (excluding restaurant/takeaway and baked goods).
32%* of the cocoa used in HEMA’s own-brand products (kg) (supplied in the 2025 financial year) was sourced through the Tony’s Open Chain initiative (excluding restaurant/takeaway and patisserie).
cocoa, palm oil, meat, dairy and fish:
Percentage by weight of the ingredient supplied
* Data in 2025 is presented based on the accounting policies and definitions described below and is subject to a limited assurance engagement under NV COS 3000. We refer to page 118 for the auditor's Limited Assurance report.
methodology and assumptions
The scope covers (own-brand) products supplied to HEMA in the 2025 financial year. In addition, the survey focused solely on the non-perishable and fresh products sold in the shop. Products sold in our restaurants, takeaways and in our bakery section are not included. Under coffee and tea, hot drinks are included, so not, for example, Easter eggs with coffee extract. The weights per product from the food specification system were linked to the quantities of products delivered in order to calculate the total weight of products delivered.
For cocoa, all products containing cocoa as an ingredient were included. We looked at the weight of cocoa ingredients in these products.
Rainforest Alliance, Fairtrade and organic are quality marks certified by an independent party. These are the only quality marks that HEMA accepts for coffee, tea and cocoa.
Tony’s Open Chain
Tony's Open Chain is an initiative that aims to create a transparent cocoa chain, where farmers receive a fair price for their cocoa. In 2023, we announced that we were joining Tony's Open Chain. In this way, we support Tony Chocolonely’s mission to source cocoa in accordance with their five sourcing principles and thus put an end to exploitation in the cocoa industry.
methodology and assumptions
The KPI relates to products supplied to HEMA in the 2025 financial year. Only HEMA own-brand products are included in the scope. In addition, only long-life and fresh products sold in the shop were considered; products sold in our restaurants, takeaways and in our pastry department were not included. The weights of the cocoa ingredients for each product, as recorded in the food specification system, have been linked to the quantities of products delivered in order to calculate the total weight of cocoa purchased.
non-food
pieces
2024
2025
cotton with a quality mark
Better Cotton, GOTS, OCS, GRS
96.4%
99.7%
organic cotton in fashion
GOTS, OCS
62%**
65%*
wood & paper
FSC
96%
95%
palm oil (cosmetics)
RSPO
99%
98%
natural rubber
FSC
-
34%
kg
2024
2025
Recycled polyester in fashion
-
39%
down and feathers
GRS
100%
100%
viscose
Ecovero
-
43%
keurmerken
non-food
Share by weight of product/material supplied (kg), except for cotton (in units).
* Data in 2025 is presented based on the accounting policies and definitions described below, and is subject to a limited assurance engagement under NV COS 3000. We refer to page 118 for the auditor's Limited Assurance report.
** Data for the second half of 2024 is presented based on the accounting policies and definitions set out below, and is subject to a limited assurance engagement under NV COS 3000. We refer to page 118 for the auditor's Limited Assurance report.
methodology and assumptions
This KPI covers all products delivered to the fashion department in the second half of 2024 and the 2025 financial year. We checked whether an item contains cotton and, if so, whether that cotton bears a GOTS or OCS quality mark and has been certified as such by an independent body. The analysis looked at the total number of items supplied that contain organic cotton, divided by the total number of items purchased that contain cotton.
textiles
total weight
cotton
68%
organic
31%
BCI (Better Cotton Initiative)
67%
GRS cotton
1%
total weight
synthetic
26%
% recycled
29%
other
5%
total recycled
8%
E2/3/4-2
actions
Our strategy for reducing our negative impact on the natural world is built around five key areas. Each lever focuses on a specific part of the chain. For example, by 2025 we will have made choices to use more (pre-consumer) recycled materials and more organic cotton.
lever 1
1
Conscious procurement of materials and ingredients
E2 E3 E4
lever 1
conscious procurement of materials and ingredients
By using recycled and renewable materials, we become less dependent on new raw materials. This makes our supply chain more resilient and reduces the pressure on ecosystems. When purchasing materials and ingredients, we take the following measures:
- We give preference to renewable materials in textiles, so that fewer microplastics end up in the environment during the product’s life cycle.
- We are using more (pre-consumer) recycled materials in textiles and are exploring ways to reprocess post-consumer textiles into new products.
- When it comes to hardware, we are also aiming to increase the proportion of recycled materials. Post-consumer where possible.
- We do not use certain materials, such as loose glitter (due to microplastics) and leather that is not a by-product of the meat industry.
- We are exploring ways to increase the proportion of plant-based proteins, as they have a lower environmental impact than animal proteins.
2025: We are increasingly using linen in our clothing, a natural fibre that is inherently strong and requires less water and fewer pesticides than cotton. Almost the entire plant can be used, meaning there is very little waste. What’s more, a large proportion of our linen comes from Europe, where the flax can grow largely on natural rainwater. This is how we create comfortable, high-quality clothing with a lower environmental impact.
We also organised a Food Impact Event for our suppliers, innovation partners and employees. The day was all about innovation, supply chain collaboration and future-proof choices. The programme began with an introduction by Jurriaan, our CFO, on the importance of integrated value creation, followed by inspiring talks from, among others, Hille van der Kaa (Those Vegan Cowboys) on innovative solutions in the food sector. At the food market and in the innovation labs, suppliers, partners and colleagues worked together on new ideas and shared technologies and products, with a particular focus on tasty plant-based innovations.
our materials matrix helps us make better choices
textiles
| best | better | preferred | not preferred |
|---|---|---|---|
| Recycled cotton | Organic | BCI cotton | Conventional cotton |
| Recycled polyester | Recycled polyester (PET) | Bio-based polyester | Conventional polyester |
| Recycled viscose/lyocell | TENCEL lyocell, TENCEL modal, ECOVERO viscose | Conventional viscose | |
| Recycled acrylic/nylon | Conventional acrylic/nylon | ||
| Recycled wool | RWS merino wool, RMS mohair wool, RWS sheep’s wool | RWS (mulesing-free) or RMS wool yarn | Conventional wool |
| Recycled down and feathers | Conventional / RDS down and feathers | ||
hardware
| Better | preferred | not preferred |
|---|---|---|
| FSC-certified recycled wood/paper | FSC-certified wood/paper | Conventional wood/paper |
| Recycled plastic / bio-based plastic | Conventional plastic | |
| FSC-certified recycled rubber | FSC rubber | Conventional rubber |
| RSPO (segregated) palm oil | RSPO (mass balance) palm oil | Conventional palm oil |
| Recycled leather | LWG-certified leather | Conventional leather |
lever 2
purchasing raw materials and supplies with recognised quality marks and certifications
2
E2 E3 E4
lever 2
purchasing raw materials and supplies with recognised quality marks and certifications
Quality marks are an important tool for ensuring that products meet minimum sustainability and animal welfare criteria. When it comes to the environment, for example, FSC-certified timber, which reduces the risk of deforestation, and regenerative cotton, which helps farmers improve soil health, have a significant impact.
We are aware that quality marks do not in themselves offer a complete guarantee: risks remain even within certified supply chains. That is why we combine quality marks with additional measures, such as improving traceability, conducting supplier assessments and analysing risks. In this way, we are working to reduce our negative impact throughout the supply chain. We continuously review the policy and update it where necessary, in consultation with stakeholders. Further information on this can be found in the due diligence policy.
2025:Wehave increased the proportion of organic cotton in our fashion collections by 2.7% compared with 2024, to 65% of items.
This means that, for the organic cotton used in our fashion collections, no artificial fertilisers, chemical pesticides or genetically modified organisms (GMOs) are used in the cotton production process.
lever 3
tackling water pollution in textile supply chains
3

E2
lever 3
tackling water pollution in textile supply chains
Water pollution is a key concern within our textile supply chain. Production sites use chemical processes that increase the risk of pollution of local water sources. That is why we base our policy on the international ZDHC Wastewater Guidelines, which set requirements for the quality of wastewater and its effective filtration. Compliance with these guidelines is monitored via the amfori platform and represents an important step towards cleaner production and the protection of local ecosystems.
2025: By 2025, we will have set specific targets for the implementation of the ZDHC Wastewater Guidelines within our textile supply chain. These objectives include improving the quality of wastewater, effectively filtering out harmful substances, and monitoring compliance at production sites via the amfori platform.
This marks an important step towards cleaner production processes and the protection of local aquatic ecosystems. The aim is to ensure that all our textile production sites (with wet processes) comply with the ZDHC Wastewater Guidelines by 2030.
lever 4
ensuring the traceability of the supply chain for raw materials with a high risk of deforestation
4
E4
lever 4
ensuring the traceability of the supply chain for raw materials with a high risk of deforestation
We are working to ensure that raw materials with a high risk of deforestation can be traced. With the implementation of the EUDR (Deforestation Regulation), we are increasing the certainty that timber and other raw materials have been produced legally since 2020 and do not contribute to recent deforestation.
Improved traceability enables us to take further action and continue to combat deforestation in the supply chain, in close collaboration with our suppliers. We are looking into the best way to do this.
lever 5
improving the efficiency of water use during the raw materials phase and production processes
5
E2
lever 5
improving the efficiency of water use during the raw materials phase and production processes
Water is an essential resource in the production of many HEMA products: from cotton and crops for food products to chemical processes for cosmetics and household goods. The raw material stage of these products often involves the use of large amounts of water, which can lead to the depletion of local water sources and put pressure on ecosystems. The impact and risk analysis we carry out using Spirefly helps us to identify water-intensive supply chains and hotspots and take targeted action. BEPI audits also provide insight into water usage at production sites.
At the same time, we are aiming to increase the proportion of cotton that carries quality marks promoting water efficiency, such as organic, regenerative and recycled cotton.
2025: Over the past year, we have conducted extensive research into opportunities to source regenerative and recycled cotton, with a focus on reducing water consumption and improving soil health. By 2026, we will be able to specifically increase the proportion of these cotton varieties used in our products, thereby contributing to more efficient water use and a reduced impact on local ecosystems.
materials and circularity
E5 IRO-1
our material impacts, risks and opportunities
We design products that last longer, can be reused or recycled, and we choose materials and production methods that have a lower environmental impact. We realise that every product, however carefully designed, has an impact on people and the environment. We are committed to reducing that impact. In our own operations, too, we minimise waste and focus on reuse and recycling.
Our approach is in line with the Ellen MacArthur Foundation’s (EMF) definition of a circular economy, which is based on three core principles:
- Preventing waste and pollution.
- Reusing products and, where this is no longer possible, repairing or recycling them.
- Making informed choices about materials and implementing efficient production processes.
KPIs and objectives
E5
circularity
IRK
onderwerp
Use of non-renewable raw materials
Strict and evolving legislation
Damage to reputation
Circular business practices
beschrijving
HEMA uses raw materials sourced from global supply chains, including non-renewable raw materials. In doing so, we are contributing to the depletion of the earth’s resources.
Governments may introduce increasingly stringent regulations to promote the transition to a circular economy, which could result in higher compliance costs and fines.
If HEMA fails to keep pace with standards on responsible and circular business practices, this could result in reputational damage and a decline in turnover.
Both circular products and services (such as repairs, product hire and second-hand sales) can create new sources of revenue, lead to a larger customer base and increase customer loyalty.
waardeketen
tijdshorizon
current positive impact
current negative impact
risk
potential positive impact
potential negative impact
opportunity
raw materials/ingredients
production
logistics
online and offline store
customers
second life
short
(< 1 year)
medium
(1-5 year)
long (> 5 year)
objectives and results
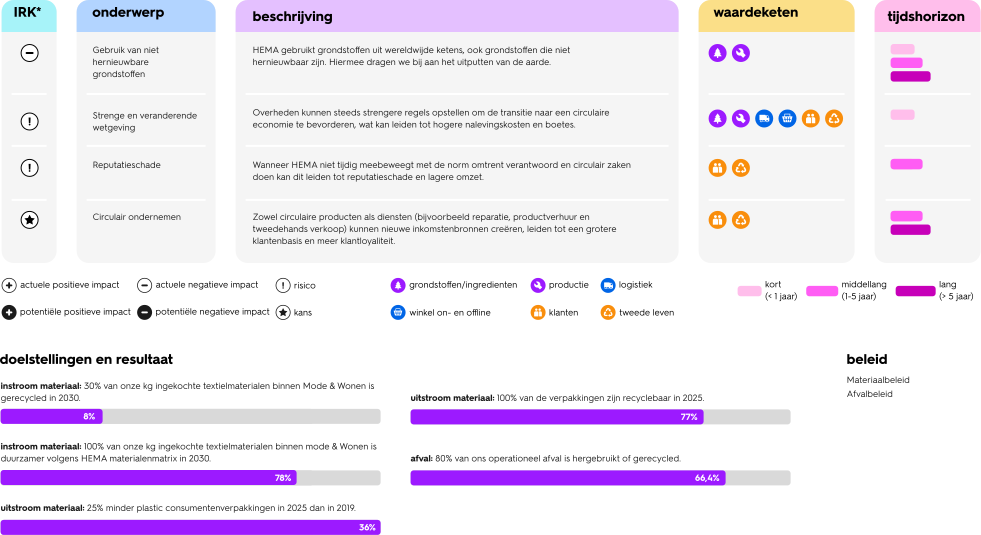
incoming materials: By 2030, 30% of the weight of textile materials we purchase within Fashion & Home will be recycled.
8%
outflow of materials: 100% of packaging will be recyclable by 2025.
77%
incoming materials: By 2030, 100% of the textile materials we purchase by weight for our Fashion & Home ranges will be more sustainable, according to HEMA’s materials matrix.
78%
waste: 80% of our operational waste has been reused or recycled.
66.4%
waste stream: 25% less plastic consumer packaging in 2025 than in 2019.
36%
policy
- Materials policy
- Waste policy

jersey shirts
Our jersey shirts: one of the most popular items in our collection for years. Jersey is a stretchy, supple and comfortable knitted fabric. Nevertheless, in our own HEMA quality lab, we’re always looking at ways to improve our products so that they last even longer. That’s why we’ve set about improving our jerseys, step by step.
For the new shirts, we opted for organic cotton and longer cotton fibres, which produce a stronger, smoother fabric that is less prone to wear and pilling. One example of how we are constantly improving to offer products that last longer.
our products last longer
From smart design to high quality: we make products that last longer. We carry out extensive testing in our own lab to ensure that our clothing and hardware remain in good condition, are comfortable to use and are easy to repair or pass on. Step by step, we are increasing the proportion of recycled materials and helping customers to keep their products in good condition for longer.
This is how we’ve created a true HEMA range, featuring products that last longer, need replacing less often, and are better for your wallet and the planet.
E5-1
policy
Our policy to promote circularity focuses on the entire supply chain, from design and procurement to use and reuse. At every stage, there are opportunities to reduce the use of primary raw materials and keep materials in the cycle for as long as possible. We therefore focus on the areas where we can make the greatest impact, such as design choices, use of materials and waste prevention.
read more about our policy
policy
In addition to the materials policy described above, we have set out our policy in the following documents:
The waste policy sets out how we manage our waste, packaging, food waste and end-of-life products. The guiding principle is to minimise (residual) waste and to process it in as circular a manner as possible. We achieve this by preventing wastage and unsold stock, and by continuously improving the way we sort our waste.
We try to prevent food loss and waste as far as possible; if there are any leftovers, we try to offer them in our shops via Too Good To Go, donate them to the Food Bank, or process them in the most sustainable way possible. In addition, we work with Wolkat to collect textiles and ensure they are processed responsibly, so that materials can be reused and the pressure on primary raw materials is reduced. In 2025, we collected 22,309 kg of textiles from customers (post-consumer) and sent them for reuse or recycling.
For packaging, we focus on three key areas:
- Reducing packaging materials: where possible, use alternatives made from paper, cardboard or single-material products.
- Use of recycled and renewable materials:
- Paper and cardboard, preferably FSC-certified or recycled.
- Plastic: a target of 20% recycled or bio-based.
- Promoting recyclability and reusability: single-material products where possible, refillable packaging, and collaboration with research institutions to continuously improve policy.
E5-2
actions
HEMA’s strategy to operate in an increasingly circular manner is built around four reduction levers. Each lever focuses on a specific aspect of our supply chain and business operations, from material selection to product design and collaboration with supply chain partners. “Around 80% of a product’s environmental impact is determined as early as the design stage.” “That’s why colleagues are already making informed choices at that stage,” says Milou America, Senior sustainability specialist (environmental impact).
That is why, since 2025, we have had a materials library for our colleagues and use checklists covering sustainability, repairability and recyclability in new product designs.
lever 1
1
conscious procurement of materials
lever 1
conscious procurement of materials
By using recycled and renewable materials, we reduce our reliance on new raw materials, which may become scarce.
- We give preference to renewable materials in textiles, so that fewer microplastics end up in the environment during the product’s life cycle.
- We are using more (pre-consumer) recycled materials in textiles and are exploring ways to reprocess post-consumer textiles into new products.
- When it comes to hardware, we are also aiming to increase the proportion of recycled materials used, including post-consumer materials where possible.
- We do not use certain materials, such as loose glitter (microplastics), leather that is not a by-product of the meat industry, angora wool, and plastic for disposable products in the hospitality sector.
2025: Last year, we developed a sustainability checklist for designers. This helps designers to make informed choices right from the start of the design process, for example regarding the use of materials, energy consumption, and the repairability and recyclability of products.
In addition, an online materials library has been developed where designers can compare different materials based on their properties and CO₂ emission factors. This gives designers a better understanding of the environmental impact of their material choices. Work is also underway to create a physical materials library to further support this. These tools help designers make more sustainable choices and are in line with our design approach: smarter, longer, more often.
lever 2
circular product design
2
lever 2
circular product design
As well as using more sustainable materials, we are focusing on circular product design. This means that a product can be reused, be multifunctional, or be adaptable as the user grows.
- We design smarter so that products can be used frequently. Our designers come up with clever solutions such as multifunctional, adaptable, energy-efficient or timeless products.
- We also give preference to renewable materials.
- We design products that last longer. To ensure quality and durability, we test our products in our own laboratory. Products can be given a new lease of life when a customer reuses, passes on or has them repaired.
- We use materials more often. We are using more and more recycled materials and moving towards products that are easier to recycle.
2025: By 2025, we will also have improved the quality and sustainability of various products based on customer feedback and product testing. For example, we have adapted the production process for knitted viscose shirts by using less fabric softener and packing the products less tightly, thereby preventing marks and white stains. For muslin products, such as muslin squares, we have modified the fabric construction to make the seams stronger and more durable. We have also improved the finish of the fabric used in our viscose nappy rompers, meaning they are now more resistant to wear and tear and meet our strength testing standards. These improvements help ensure that products remain attractive and functional for longer.
lever 3
minimising waste and ensuring high-quality processing
3
lever 3
minimising waste and ensuring high-quality processing
At HEMA, we take a responsible approach to waste, both in our own operations and for our customers. By sorting and recycling waste properly, it can be reused as a secondary raw material.
- We reduce operational waste, optimise waste sorting (including residual waste streams) and, together with our supply chain partners, increase the recycling rate.
- The biggest source of household waste is packaging. We are reducing packaging material wherever possible and replacing it with materials that contain less plastic and are more reusable, refillable or recyclable.
- For textile collection, we work in partnership with Wolkat to reuse the textiles or recycle them in a more sustainable way.
- We are reducing food waste by partnering with Too Good To Go and the Food Bank and by improving stock planning.
2025: Last year, we switched to a new specification system that allows us to record our packaging data in much greater detail. This gives us a better understanding of our impact and enables us to prepare thoroughly for the upcoming European packaging legislation.
This is also a significant moment for HEMA: the conclusion of its previous packaging targets and an opportunity to look back on the results achieved, with new ambitions for 2030. In 2025, the focus was on three key areas: reducing plastic, using recycled and renewable materials, and improving recyclability and reusability. This applied to consumer packaging as well as transport and outer packaging.
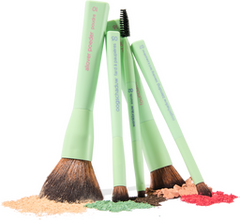
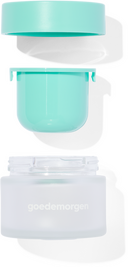
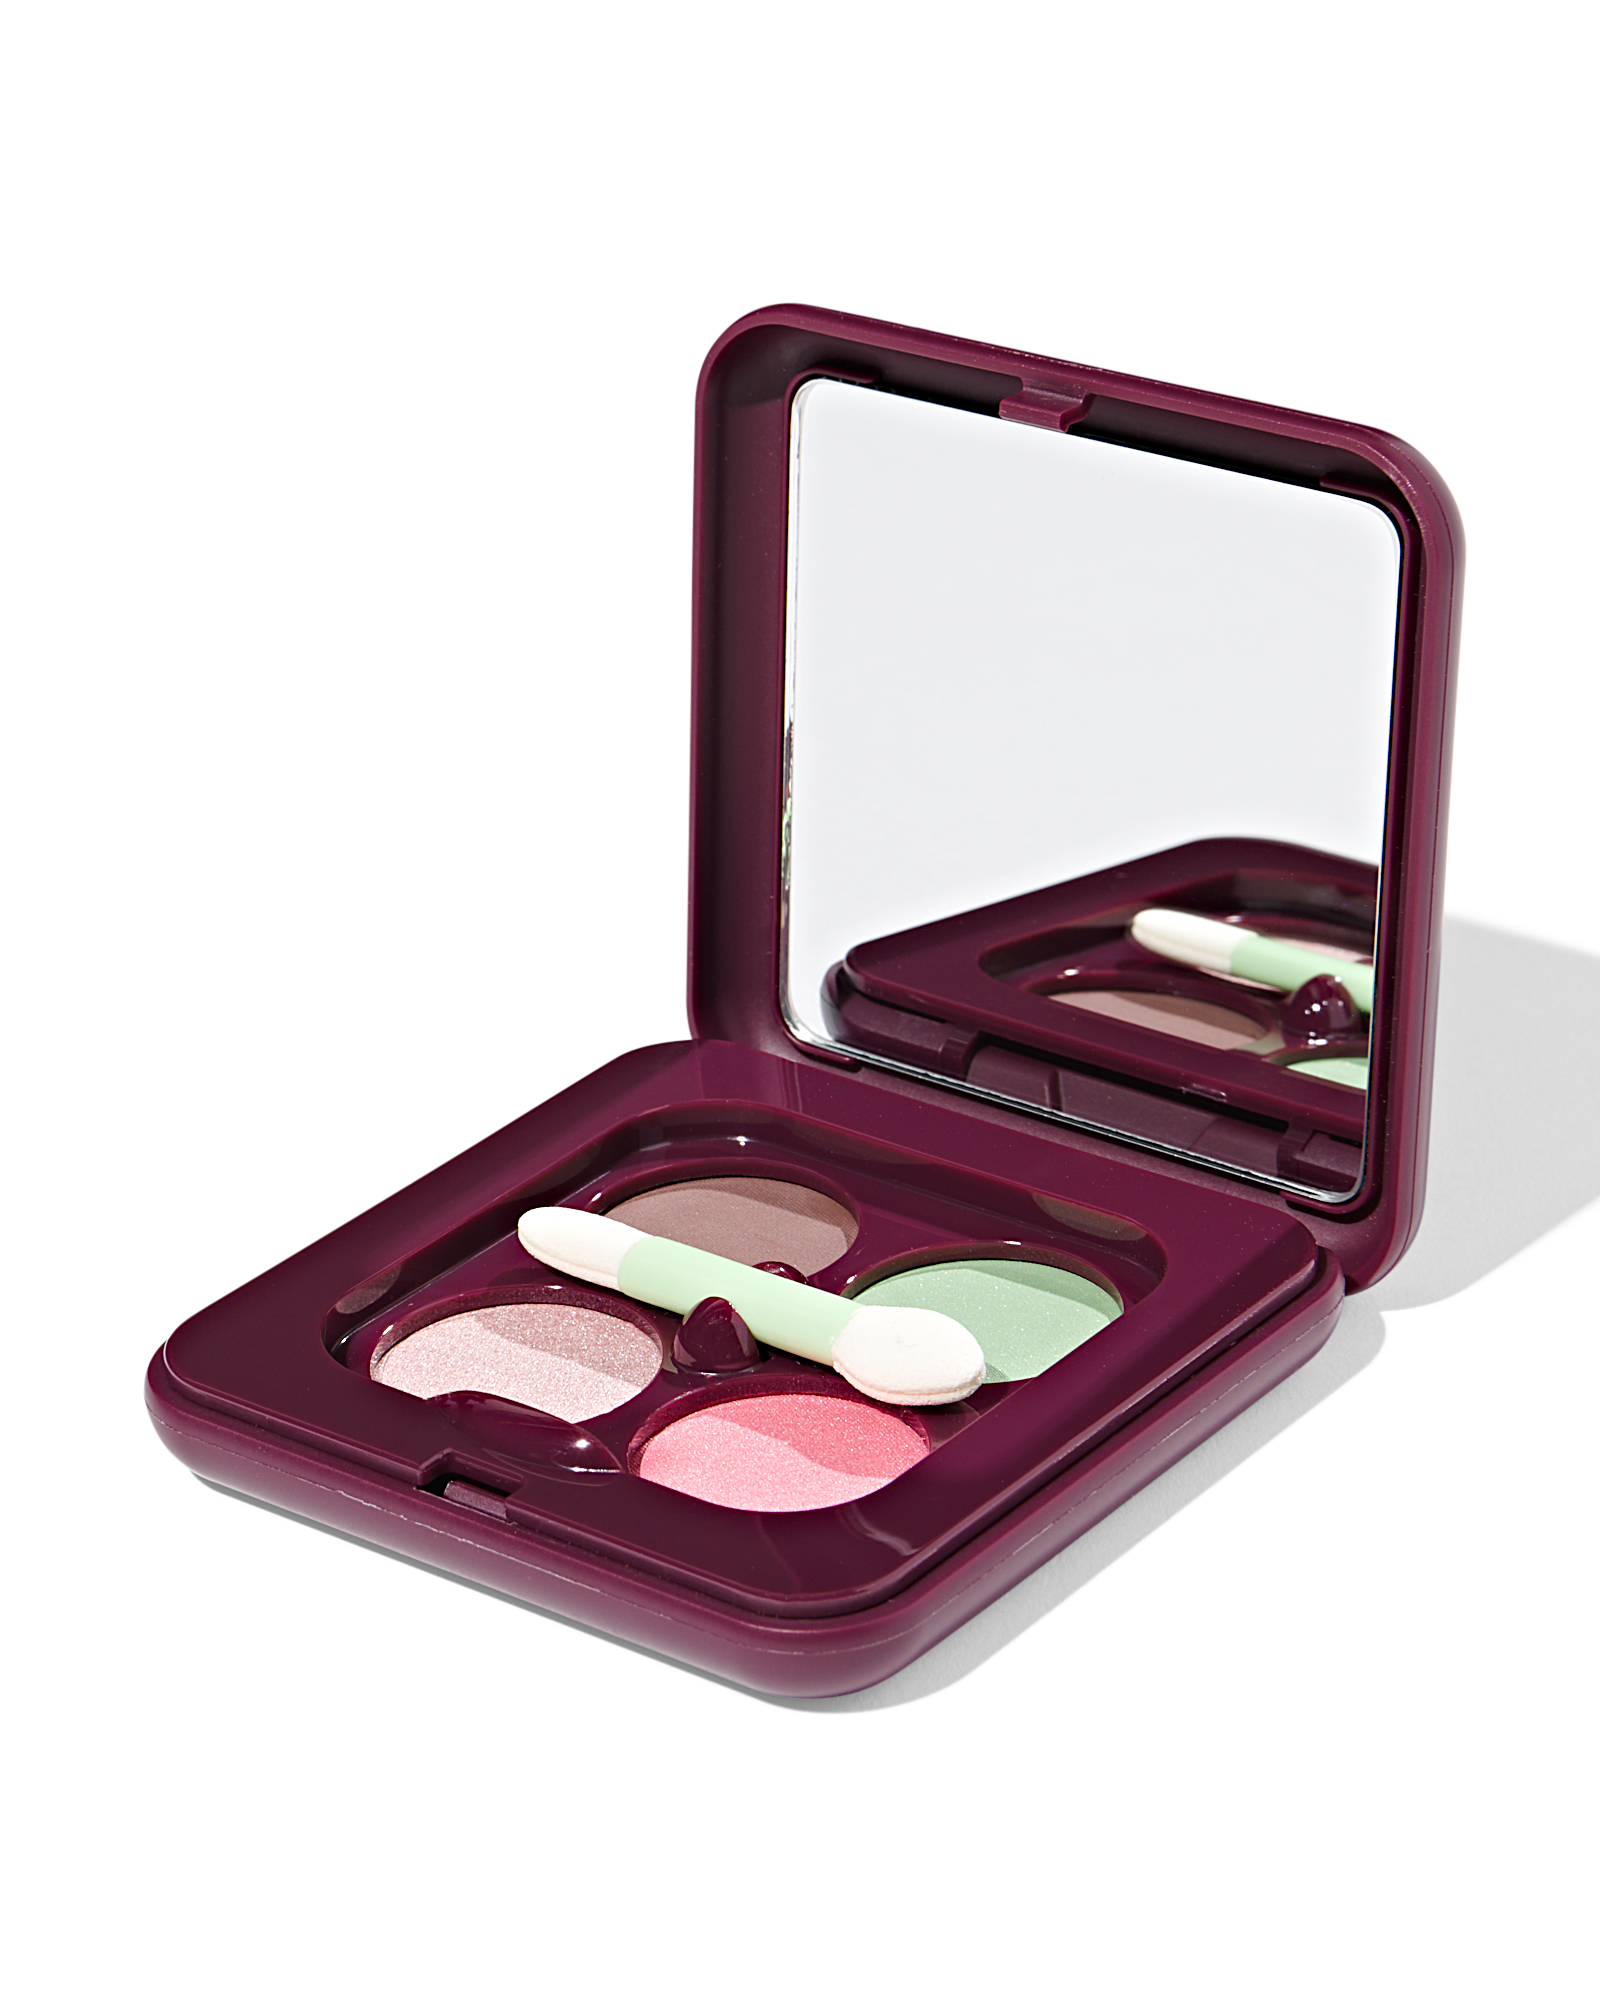
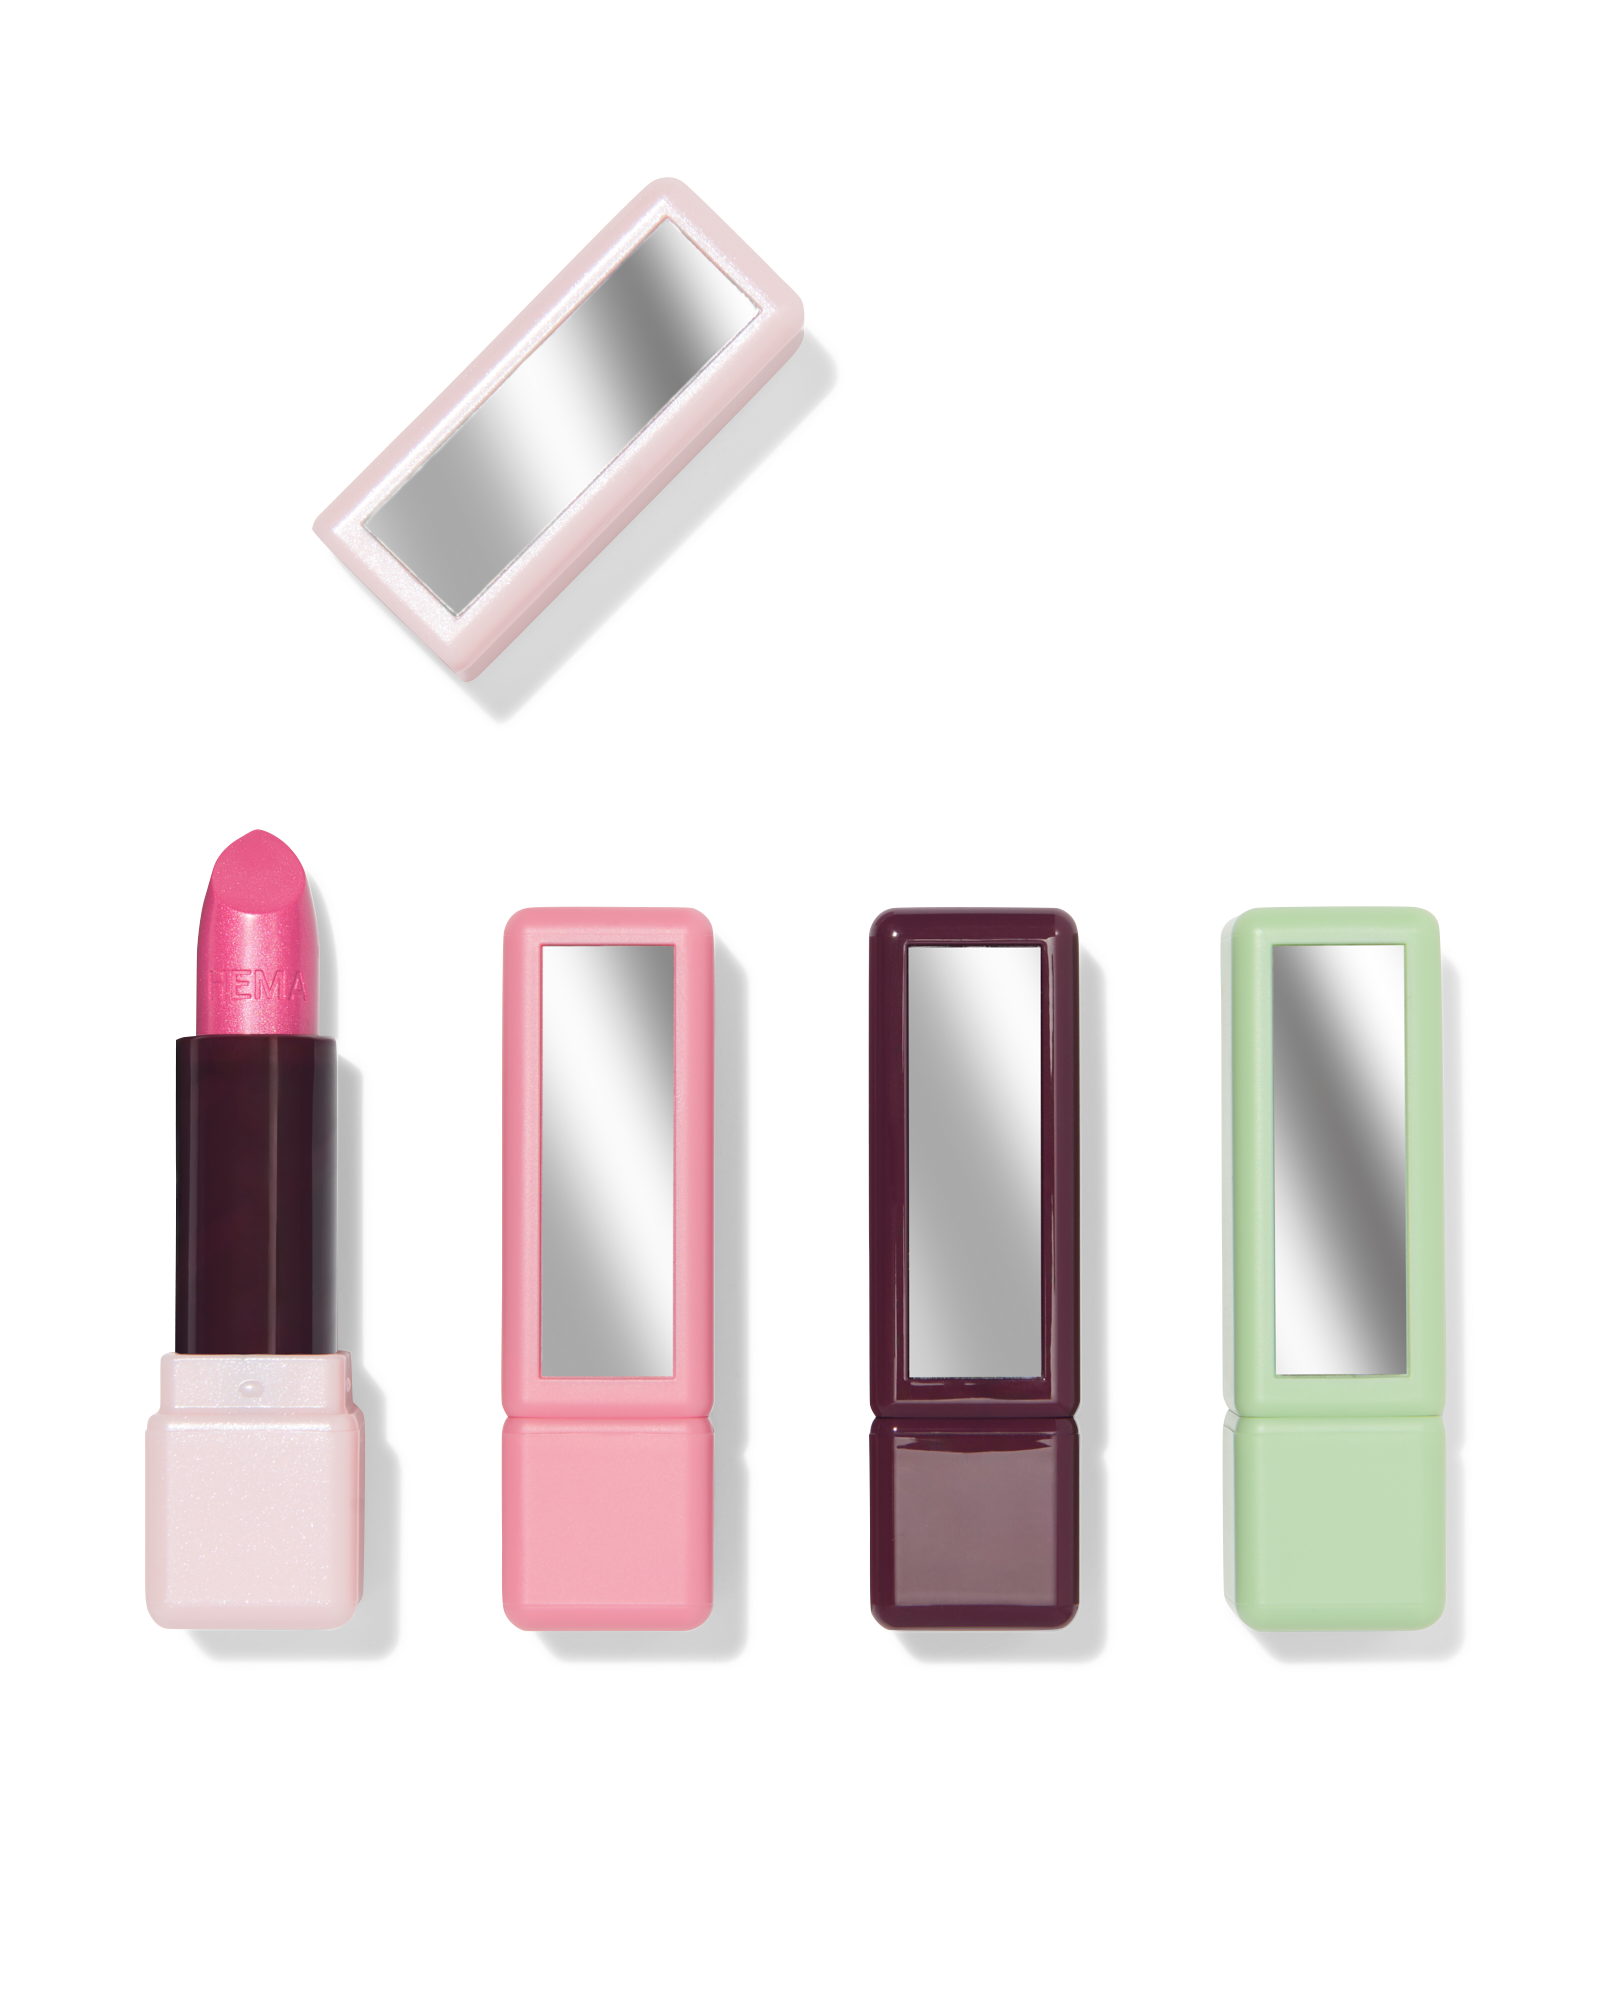
We have completely revamped our beauty range: lipstick, blush and powders are now all refillable, and whereas previously only eyeshadow was refillable, the entire range has been updated.
We’ve learnt a great deal from the packaging for our refillable eyeshadows; we’ve applied those insights to all our other make-up products. We learn from past innovations and apply this knowledge across the board.
It was clear, however, that refillable packaging requires a change in consumer behaviour. It takes time and explanation for refillable products to be accepted and adopted. HEMA has supported this with a targeted communication campaign to guide consumers through the process step by step: how refilling works and why it is sustainable. We also learnt that make-up packaging simply has to look good; it’s about more than just its function. The colour needs to be right, the packaging must be attractive, and the whole thing must fit in with the rest of the collection.
Over the past year, we have once again replaced plastic packaging with cardboard. Beauty accessories are now displayed on cotton cards, and underwear and T-shirts are wrapped in cardboard sleeves rather than plastic bags. Feedback from shop employee was taken into account to ensure that the packaging remained functional and sturdy.
Nienke van der Veen, Packaging Specialist at HEMA:
“By 2023, we had already exceeded our plastic reduction target.” At the same time, we came up against a problem: reducing our total packaging weight turned out to be more complex than we had anticipated.
In preparation for the new European PPWR legislation, HEMA collected detailed information on packaging in 2025: type of plastic, colour, recyclability, recycled content and reusability. Suppliers, particularly those outside Europe, were informed and trained, and the manuals were updated.
lever 4
exploring circular business models
4
lever 4
exploring circular business models
HEMA is constantly exploring ways to make its products circular. This can be done, for example, by repairing, reusing, renting out or selling products second-hand. We are mapping out various models and working with potential supply chain partners to explore how we can put these concepts into practice.
E5-5
KPIs and results
packaging
The results paint a largely positive picture. We have managed to reduce the amount of plastic in our consumer packaging by 36%. We measure this by comparing the amount of plastic packaging per item with the amount in 2019. In our previous sustainability report, we already indicated that the overall reduction target was unlikely to be met, as plastic is frequently replaced by cardboard, which is naturally heavier. Nevertheless, we are achieving an overall reduction of 5%.
In order to use more sustainable materials, we aim to use only recycled or certified paper and cardboard, and as much recycled plastic as possible. The use of recycled plastic is falling short of the target, partly due to the higher price and limited availability of post-consumer recycled plastic. That is why we are carrying this objective forward to 2030, when we will further tighten the requirements.
The final objective focuses on recyclability. Although we haven’t quite reached 100% yet, 77% of our packaging is already recyclable. For some types of packaging, there is not yet a suitable recycling route, such as small packaging for mascara, for example. We will also carry this objective forward to 2030 and align it with the forthcoming European PPWR regulations.
waste
We work closely with our waste processors to ensure that waste streams are processed in the most circular way possible. Proper waste sorting is essential in this regard. Some of the waste is returned to our distribution centre, where it is collected; other waste streams are collected directly from the shops. We always do this in accordance with the applicable legislation, and where possible, we go the extra mile. Over the coming year, we will be taking steps to improve the sorting of food waste, prevent wastage in shops through smart (stock) planning, and collect unsold textiles separately. At the same time, our waste management companies continue to invest in better recycling techniques, enabling more and more of our waste to be reused. In this way, we are working step by step towards reducing waste and increasing reuse.
KPI’s overzicht
materiaal uitstroom
| KPI | details | 2025 | ||
|---|---|---|---|---|
| Waste | Hazardous waste | Non-hazardous waste | Total | |
| Total waste | For the financial year (in tonnes) | 65.851 | 11.735.764 | 11.801.616 |
| Completely diverted from disposal | For the financial year (in tonnes) | 65.817 | 11.577.223 | 11.643.040 |
| Total sent for disposal | For the financial year (in tonnes) | 34 | 158.541 | 158.575 |
| Proportion of non-recycled material | As % of the total | 33,6% | ||
| Textile collection | ||||
| Post-consumer textiles collected and sent for reuse or recycling | For the financial year (in tonnes) | 22.309 | ||
2025 targets
25%
less plastic consumer packaging than in 2019
result: 36% less
25%
less consumer packaging than in 2019
result: 5% less
100%
of consumer plastic packaging is made from recycled plastic
(at least 20% PCR) or bio-based plastic
result: 19%
100%
of consumer packaging is recyclable
result: 77%
new targets for 2030
reduce
- 75% of the items in the shop are packaged without plastic (excluding (food & beauty)
packaging is considered plastic-free if it contains less than 5% plastic by weight.
- 10% reduction in the total amount of packaging material compared to 2025
measured as a reduction in the total weight of packaging (kg) purchased, across all packaging layers and all items.
recycled and renewable materials
- at least 35% recycled plastic or bio-based plastic for all packaging
measured as the weight of recycled or bio-based plastic as a proportion of the total weight of plastic.
- all paper and cardboard packaging is made from recycled or certified sources.
recyclability
- all packaging is recyclable (including reusable packaging)
in this regard, we follow the guidelines and frameworks set out in the PPWR