environment
At HEMA, we make beautiful, practical and better products for everyone. For that, we depend on a healthy environment. From cotton for our rompers to wood for our kitchen utensils and fertile soil for growing our coffee, much of what we make starts in nature. Therefore, we take responsibility and work step by step to reduce our impact on the environment.

scroll down
The environment is a wide-ranging and complex topic, but we like to concentrate on specifics. We focus on five topics that are strongly interconnected: climate change, pollution, water, biodiversity and material use, and circular economy. For each theme, we identify impact and risks, set targets and measure progress.
We are not just looking at individual issues. We develop strategies and action plans for our product range that contribute to impact reductions within as many environmental themes as possible simultaneously. For example circular design, more sustainable materials, less packaging and more efficient production. This is how we ensure that corporate responsibility is increasingly becoming the standard.
Step by step, product by product, we make HEMA and the world a little more beautiful.

climate change
Global temperature rise, resource shortages and extreme weather; we see the impact of climate change all around us. This affects us as people and also as a company. We are aware that our own activities and those of companies in our value chains have an impact on the environment. This is why we are fully committed to reducing our climate footprint and building a sustainable HEMA.
We take a critical look at our own operations and at our entire chain: from production to shop floor and even afterwards at the customer's home. We take our responsibilities seriously and take an integrated approach to reducing CO2 emissions. Be it more sustainable materials, more efficient logistics or energy-efficient shops. Through smart designs, reusable materials and responsible product choices, we ensure that customers can easily make more sustainable choices, without it becoming unaffordable. This is how we make a difference together.
But how do you make products that contribute to a better world? Simple: our products start with a good idea. And the designers at HEMA, they are full of good ideas. They provide their own recognisable products, with an unbeatable design that is more practical, more beautiful and better. So that products last longer. In this mission, we explicitly choose quality and help our customers live a better everyday life.
Science Based Targets
We follow the scientific guidelines of the Science Based Targets initiative (SBTi) and have scientifically validated targets for 2030 and 2050. These targets are in line with the Paris Climate Agreement and contribute to limiting warming to no more than 1.5°C, in line with scientific scenarios that require rapid action before 2050.
our aims
in 2030:
75%
lower emissions in our own operations (scope 1 and 2) compared to 2019.
in 2030:
46,2%
lower emissions in our supply chain (scope 3) compared to 2019.
in 2050:
90%
lower emissions in our own operations (scope 1 and 2) compared to 2019.
in 2050:
90%
lower emissions in our supply chain (scope 3) compared to 2019.
our climate footprint in focus
2019-2030


view our 2023 climate footprint*
In 2023, HEMA's total climate footprint was 602 kilotonnes of CO2-eq. Within this, our own operations (scope 1 and 2) together account for 5% of total emissions. The rest of our emissions, 95%, come from indirect emissions in our value chain (scope 3), mainly driven by our purchased goods that we sell to our customers.
Compared to 2019, the total climate footprint has decreased by 16% in the period to 2023, from 717 to 602 ktonne CO2-eq. This is a significant decrease compared to the previous year, which ensures that we are again more on track against the targets and the set annual reduction rate.
*Because of the time currently needed to calculate a CO2 measurement, we look back to 2023 in this report.
our 2023 climate footprint
scope 1 & 2
own operations
Our own operations consume energy. We heat and light our shops. We transport our goods from the distribution centre to the branches. And we chill our products in coolers.
Our scope 1 emissions decreased by 26% compared to 2019, to 14 ktonne CO2-eq. These are all direct greenhouse gas emissions resulting from the combustion of gas or fossil fuels within our own operation. The vast majority of emissions are caused by gas consumption for heating our shops. In addition, the fuel consumption of our trucks also causes greenhouse gas emissions.
Scope 2 emissions have decreased by 60% compared to 2019 to 15 ktonne CO2-eq. This includes all emissions resulting from the consumption of purchased energy, such as electricity and district heating and cooling. Retail premises electricity consumption is the largest source of greenhouse gas emissions.
In recent years, much has been done and invested to reduce emissions from our own operations, especially in our shops. For example LED lighting, automatic sliding doors and more economical refrigerators. We are also increasingly using biodiesel in our own transport.
In the coming years, the focus will be on reducing energy consumption, energy efficiency and the transition to renewable energy. The reduction strategy will broadly consist of the following measures:
reducing and making better use of energy
- optimisation of energy use: implementation of energy efficiency programmes in our shops, distribution centres and offices. This includes the use of more economical lighting, insulation improvements, heating, ventilation, formula components and air conditioning (HVAC) systems, among others
- energy monitoring systems: introduction of smart meters to better monitor energy consumption and quickly address inefficiencies
transition to renewable energy
- solar: installation of solar panels on roofs of buildings where possible and cost-effective. This reduces dependence on the grid and uses renewable energy sources
- procurement of renewable energy: switching to certified green power for all facilities
fleet
- electrification of the fleet: switching to electric vehicles. 97.4%* of the fleet (passenger cars) in the Netherlands is fully electric powered
* Data in 2024 is presented based on the accounting policies and definitions described below, and is subject to a limited assurance engagement under NV COS 3000. View the independent auditor's report here.
methodology and assumptions
On reference date 02/02/2025, an export was made of all driving passenger cars in HEMA Netherlands' leased car fleet. The total fleet of leased cars in the Netherlands on the reference date consists of 78 cars. Only fully electric passenger cars are classified as electric.
biofuels and other alternatives
For the remaining vehicles, we will switch to using biofuels or other renewable fuels as a temporary solution until full electrification is possible.
our 2023 climate footprint
scope 3
value chain
This includes all indirect CO2 emissions resulting from activities in our value chain, such as the extraction of raw materials and materials for our items, their production and transport to distribution centres. It also includes the use of aircraft for business travel, waste disposal, and customers' electricity consumption, for example to boil water with our 'ketelbinkie' kettle.
In the period from 2019 to 2023, total scope 3 CO2 emissions decreased by 13%, from 660 to 572 kilotonnes of CO2-eq.
Within scope 3, the category 3.1 purchased goods and services, is the largest contributor to the total footprint. Due to the wide, varied range and high volume of purchased items, it is no surprise that this is the largest category in HEMA's overall climate footprint. This category has decreased by 11% in 2023 compared to 2019, which has a strong effect on the total emissions of scope 3 and therefore the whole of HEMA. The decrease is mainly due to a combination of a decrease in the volume of goods purchased, better, accurate calculation methods and the use of better and more sustainable materials.
For us, the biggest CO2 reduction opportunities for the coming years are expanding the share of sustainable materials and applying circular design principles. The reduction strategy will broadly consist of the following measures:
measures in range:
innovation of products and materials
developing good ideas: our designers create proprietary, recognisable products - with an unbeatable design that is more practical, more beautiful and better. So that products last longer. In this mission, we expressly choose quality and help our customers live a better everyday life
development of more sustainable and/or circular products: development of products with a lower carbon footprint by using more sustainable materials
Sustainable packaging: using recyclable or reusable packaging materials. By 2025, we want 100% of our packaging material to be recyclable or reusable
Packaging reduction: reducing packaging material through innovative design and the use of recyclable or compostable materials
making production chains sustainable
Sustainable procurement policy: evaluation and selection of suppliers based on their sustainability and environmental performance. As a result, we increase cooperation with suppliers committed to reducing their own emissions
involvement of production sites: to better understand climate impacts and reduction opportunities within our production chain, we started collecting environmental performance data from our tier 1 production sites in 2024. These sites are the first link in our production chain and are therefore important for understanding and reducing our total carbon emissions. By environmental performance data, we mean energy consumption and source, water consumption and source, waste streams and recycling. We aim for suppliers to submit their environmental performance data annually through the amfori BEPI platform. Currently, about 50% of our tier 1 suppliers have reported their data for the previous calendar year. This is an important first step in building a reliable dataset. We will use the information collected to carry out an impact analysis: we will map where the most emissions take place, and where we can make the biggest sustainability gains together with our suppliers. By measuring and reporting structurally, we can better track our progress and work in a more targeted way to reduce our climate footprint.
supplier code: we will develop a supplier code that requires suppliers to report transparently on their emissions and actively work to reduce emissions
Measures in other scope 3 categories (capital goods, upstream transport, business travel, commuting, waste, franchise shops):
The reduction strategy broadly consists of the following measures:
Leasing/purchasing properties with a sustainable energy label.
making transport more sustainable: optimising transport and logistics processes to reduce fuel consumption and emissions. This includes using cleaner fuels, efficient route planning and increasing load factors
Enhancing commuting: reducing commuting through online meetings and flexibility with regard to working from home. Encourage the use of sustainable transport, such as bicycles instead of cars, where possible
Reduce waste: Focus on designing products that last longer and reducing disposable products. Increase recyclability by choosing recyclable materials and reducing recycling-unfriendly components. We want to prevent wastage in shops through good (stock) planning
sustainable business transport: reducing business mileage through online meetings. Encourage the use of sustainable transport, such as taking trains instead of planes, where possible.
view scope 1 & 2: own operations

scope 1: direct emissions own operation
2%
14 kton CO2-eq
e.g. gas consumption, fuel consumption of cars
scope 2: indirect emissions of purchased energy
3%
15 kton CO2-eq
e.g. electricity use in shops
view scope 3: value chain
scope 3: indirect emissions from value chain
95%
573 kton CO2-eq
e.g. production of items we purchase and their energy consumption during the use phase by the customer
climate footprint in 2023
| 2019 | 2022 | 2023 | % difference compared to 2019 | ||||
|---|---|---|---|---|---|---|---|
| Total | 717.552 | 662.292 | 602.099 | -16% | |||
| Scope 1 | 18.809 | 12.465 | 13.932 | -26% | |||
| 1.1 combustion in own buildings | 7.387 | 5.573 | 4.252 | -42% | |||
| 1.2 combustion of fuels in own means of transport | 4.900 | 3.384 | 3.042 | -38% | |||
| 1.4 other direct emissions (e.g. refrigerants) | 6.522 | 3.508 | 6.638 | 2% | |||
| Scope 2 | 38.564 | 25.362 | 15.242 | -60% | |||
| 2.1 purchased electricity | 38.174 | 24.465 | 14.786 | -61% | |||
| 2.3 purchased heat | 274 | 897 | 456 | 66% | |||
| 2.4 purchased cooling | 116 | -100% | |||||
| Scope 3 | 660.176 | 624.465 | 572.925 | -13% | |||
| 3.1 purchased goods & services | 482.323 | 485.846 | 430.497 | -11% | |||
| 3.3 fuels or energy outside scope 1 and 2 | 7.718 | 6.521 | 4.668 | -40% | |||
| 3.4 transport and distribution in the supply chain | 15.092 | 17.663 | 15.981 | 6% | |||
| 3.5 waste processing | 4.025 | 3.521 | 3.996 | -1% | |||
| 3.6 business travel | 465 | 188 | 258 | -45% | |||
| 3.7 commuting | 12.250 | 12.415 | 5.187 | -58% | |||
| 3.11 use of products sold | 75.263 | 39.326 | 49.961 | -34% | |||
| 3.12 processing of sold products at end-of-life | 31.041 | 37.522 | 41.999 | 35% | |||
| 3.14 franchises | 31.999 | 21.463 | 20.378 | -36% |
our food offering
To meet our CO2 target (46.2% reduction by 2030 compared to 2019 emissions), we will start working to tackle the biggest contributors to these emissions. This requires insight. An analysis of HEMA's CO2 emissions shows that animal proteins are responsible for about 80% of the total emissions from the food we sell. In 2024, we have released a number of new vegan products in restaurants and shops.
We would like to highlight some milestones we are proud of:
new range of wraps
Three delicious flavours of wraps, with two plant-based options: hummus-vegetables and flatbread with Karma Kebab.
snackspert video

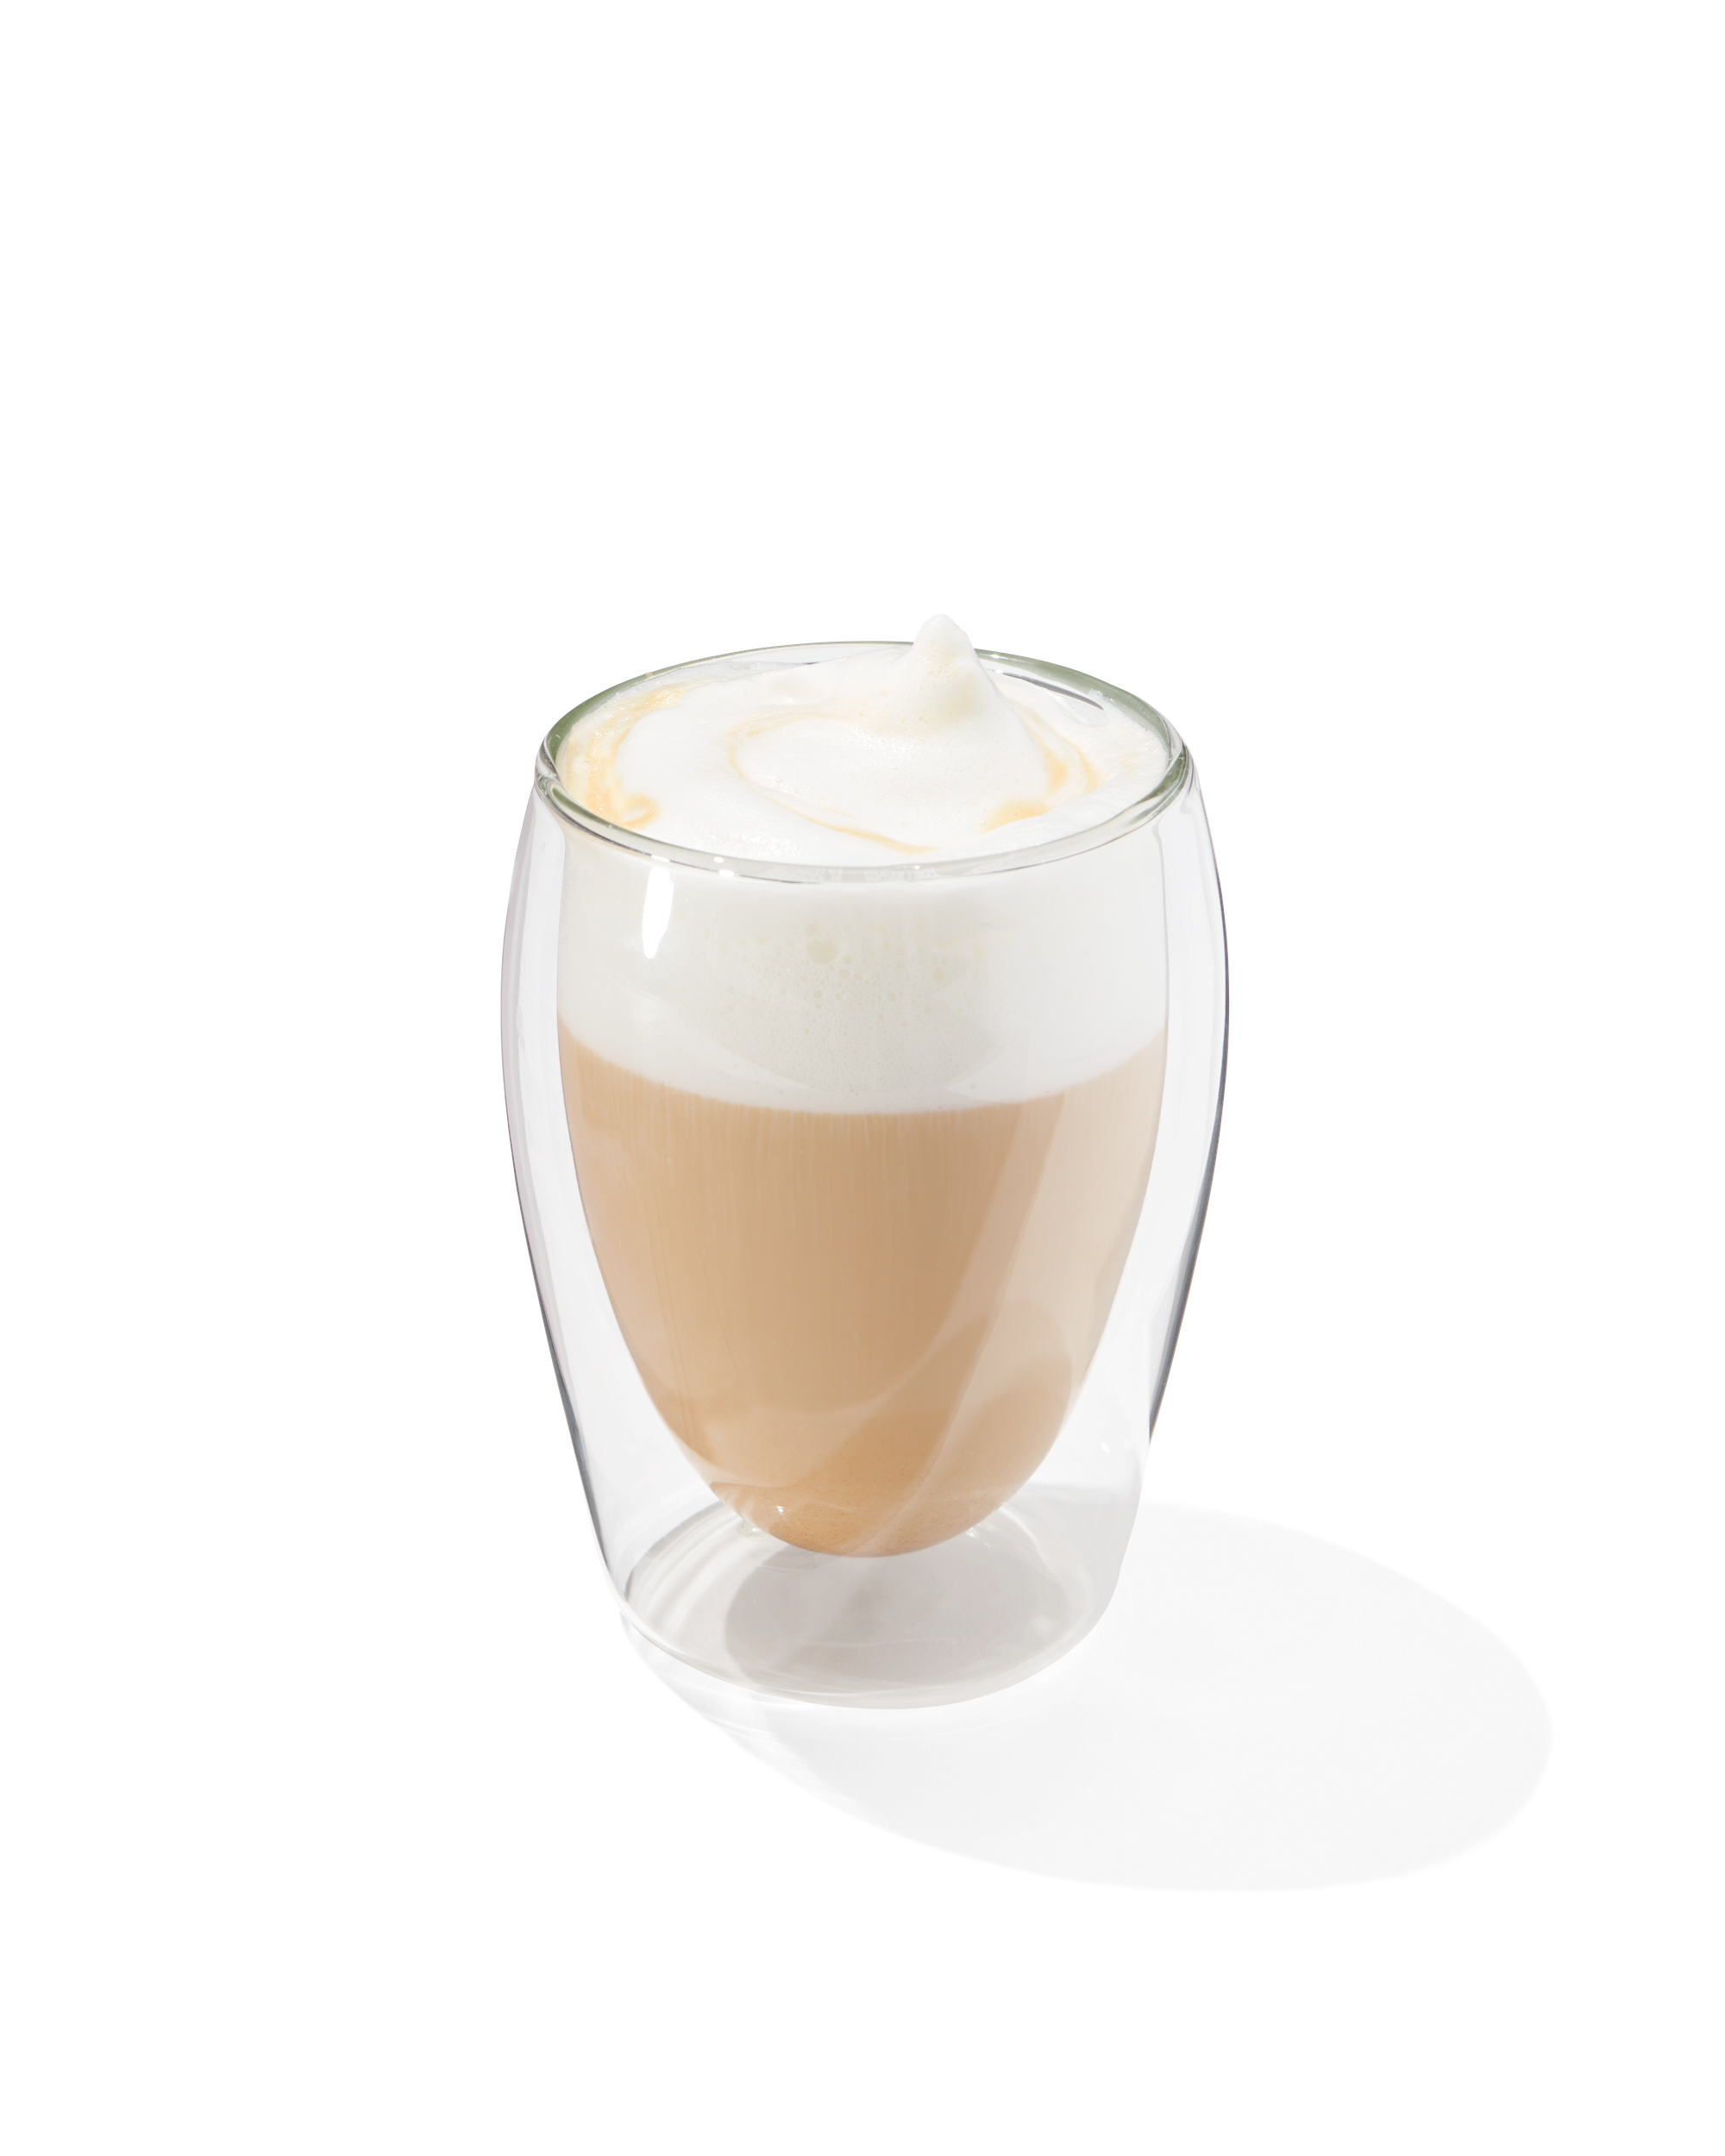
oat milk expansion
in restaurants for those who love a cappuccino with oat milk.
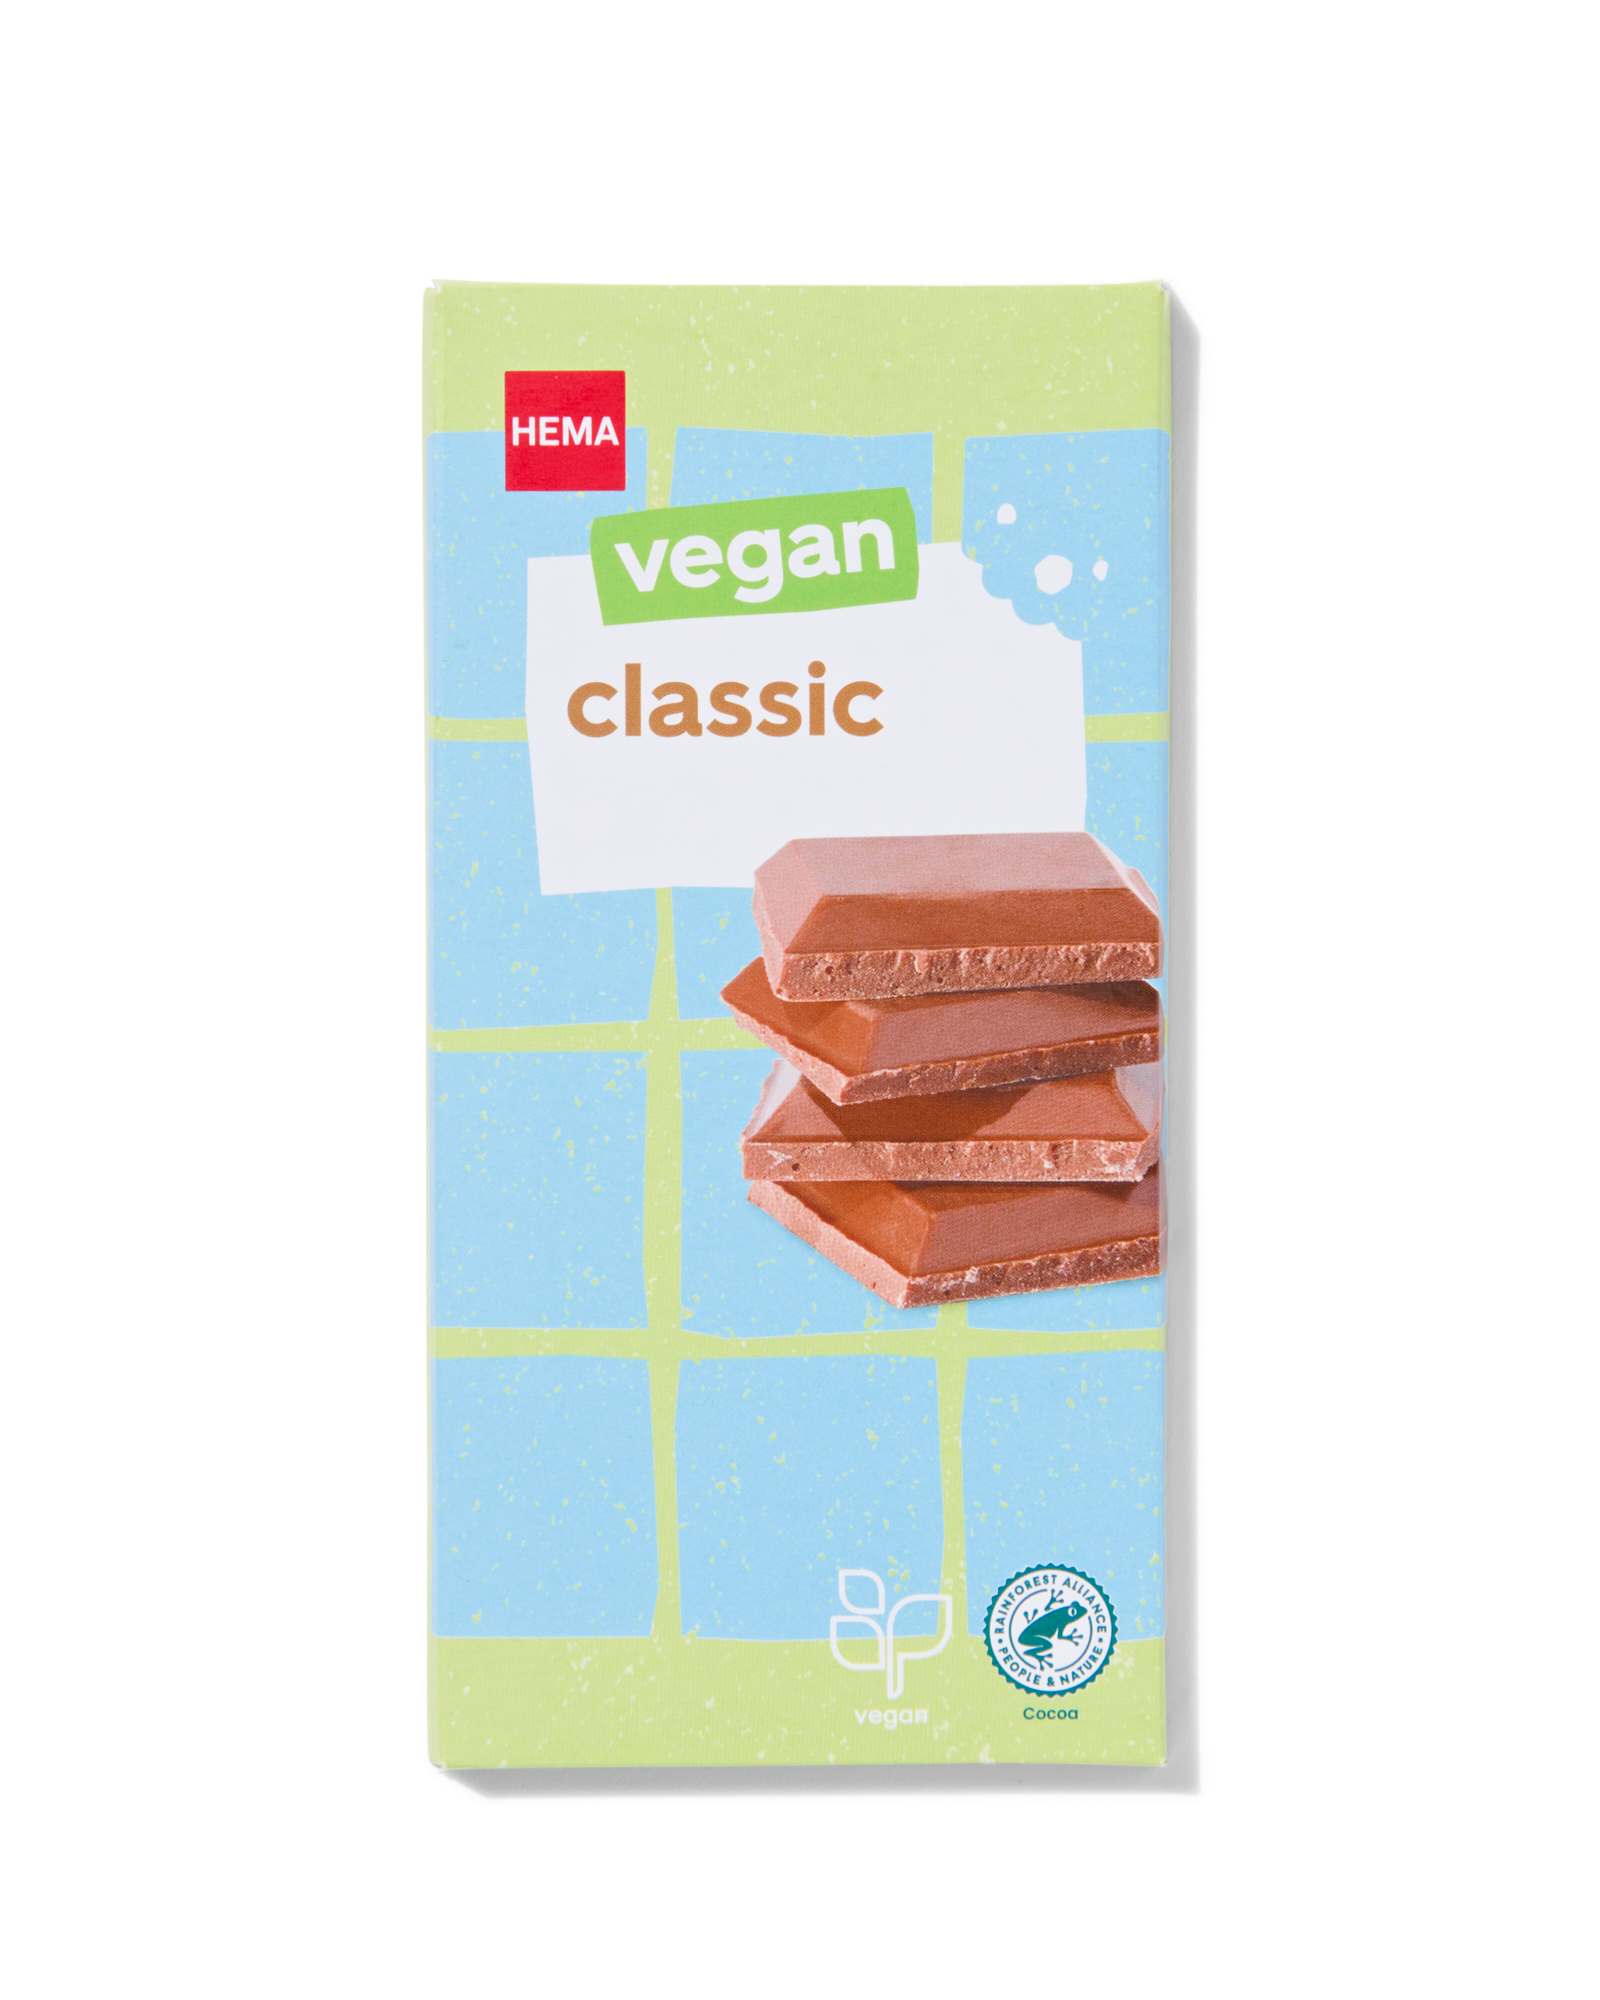
new vegan chocolate tablets and chocolate letters
A classic bar, caramel sea salt and hazelnut.
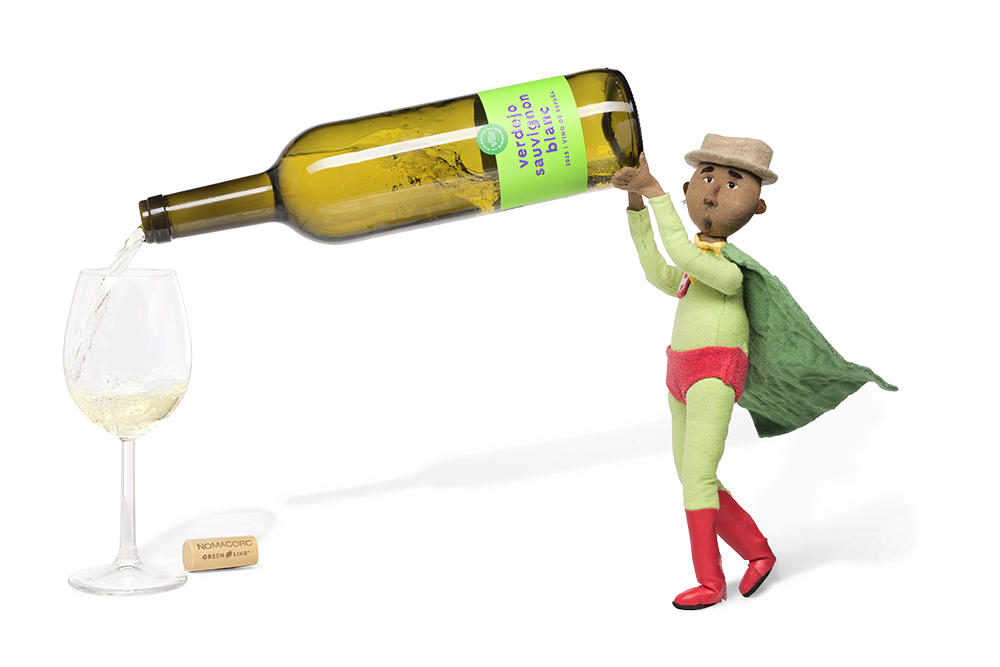
certified organic and vegan wine
The cork is made entirely of sugarcane and there is no plastic capsule at the top of the bottle.
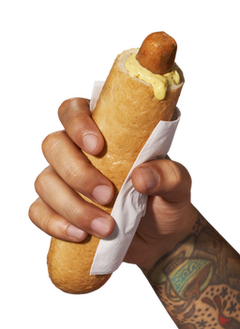
vegetarian hotdog: notdog
In restaurants. The notdog is 20 cents cheaper than the hot dog.
nature
Nature is the basis of our existence. Forests, oceans and biodiversity are essential for a healthy planet. Unfortunately, nature is under pressure worldwide. Biodiversity loss, alongside climate change, is one of the biggest global challenges of our time. In fact, the World Economic Forum calls it the third biggest risk globally. The consequences are far-reaching: fewer pollinators, declining food production, reduced water quality and disrupted climate regulation.
Within the food industry, the impact is immediate. As much as 75% of food crops, including fruits, vegetables, coffee and cocoa, depend on pollination. Conservation of biodiversity is therefore not an option, but a necessity. To restore ecosystems and prevent further damage, immediate action is required.
materials and circular economy
HEMA uses raw materials from global chains. We are aware of the risks involved. Raw materials are becoming increasingly scarce and are not inexhaustible. The linear economy, in which materials are extracted, used and discarded, is not infinitely sustainable. This forces HEMA to take a critical look at how we design, produce and allow our range to be used by customers. Always with an eye on quality. By making more room for circular principles, we aim to reduce our impact on the environment. We do this by looking at the whole chain, with a focus on our product range and the materials we use for it.
We are taking specific steps to embed circularity in our strategy. In the coming years, we will build data-driven insight into our product range to transparently report on circular material use (inflow, outflow and waste), in line with the upcoming CSRD legislation. This allows us to better drive improvement in product development and cooperation within the chain.
We focus on products that last longer, with a smaller range made with consideration for people and the environment, and with better quality. Our circular approach is aligned with the Ellen MacArthur Foundation's (EMF) definition of a circular economy, which focuses on three core principles:
- Eliminating waste and pollution.
- Reusing products and materials in a way that maximises their value.
- Restoring and renewing nature.
longer life
We design smarter so products can be used a lot. Smart design also means choosing our materials carefully. We prefer renewable materials and we have minimum requirements in the form of labels for different materials we use for textiles as well as hard goods.
We design products that do what they are made for, for longer. This is why we test our products for quality in our own in-house laboratory. Products are given a second life as a customer can reuse, pass on, or repair a product. We also inspire customers on our good idea page to maintain products properly to make them last longer.
We like to use certain materials more often. We are using more and more recycled materials and exploring what can get in the way of recycling. This is how we move towards more recyclable products.
sector collaboration
UPV textile foundation
We work closely with Stichting UPV Textiel [Dutch Foundation for Enhanced Producer Responsibility in Textiles] to achieve a circular textile chain. In this way, we are committed to making the sector more sustainable efficiently and striving for a level playing field.
Wolkat
In our shops, customers hand in used textiles in exchange for a 10% discount on a new item that lasts longer. Working with circular textile processor Wolkat, we ensure that non-usable clothes are turned into recycled products, and that usable items are given a second life.
Smarter
Refuse
R0
make products and materials redundant:
- Fewer fossil resources
- Products with multiple functions
Rethink
R1
use more intensively:
- Growing along
- Multi-use
- Essentials
- Reversible
Reduce
R2
Smart use of raw material and consumption:
- Energy-efficient appliances

Longer
Re-use
R3
Hand down:
- Chargeable
- Refillable
Repair
R4
Repair:
- Dismantle
- Standardise
- Spare parts
- Instructions
More often
Recycle
R5
Reusing raw materials:
- Recycled material
- Recyclable products
quality marks
Quality marks and labels help us make clear agreements on environmental impact and animal welfare. Think of labels like RSPO for palm oil, Beter Leven for meat or FSC for wood and paper. This allows us to improve our impact in a reliable and measurable way.
We continue to work step by step to make better choices in our chains - for people, animals and the environment. We show where we have taken steps forward and where we are on the way.
* Data in 2024 is gepresenteerd op basis van de accounting policies en definities hieronder beschreven en is onderhevig aan een limited assurance opdracht op basis van NV COS 3000. We verwijzen naar pagina X voor het Limited Assurance rapport van de accountant.
methodologie en aannames
De periode betreft aan HEMA geleverde producten in het financiële jaar 2024, dat liep van 29 januari 2024 tot en met 2 februari 2025. In de scope zijn alleen HEMA eigen merkproducten opgenomen. Daarnaast is er enkel gekeken naar de houdbare en verse producten die verkocht worden in de winkel, producten die in onze restaurants, takeaways en op onze gebaksafdeling worden verkocht zijn niet meegenomen. Voor koffie en thee zijn de warme dranken meegenomen, dus bijvoorbeeld niet de paaseitjes met koffie-extract. Aan de aantallen geleverde producten zijn de totaalgewichten per product uit het voedselspecificatiesysteem gekoppeld om tot een totaalgewicht te komen van de geleverde producten.
Voor cacao zijn alle producten die cacao als ingrediënt bevatten meegenomen. Hierbij is gekeken naar het gewicht van de cacao ingrediënten in deze producten.
Rainforest Alliance, Fairtrade en biologisch zijn keurmerken die door een onafhankelijke partij zijn gecertificeerd. Dit zijn de enige keurmerken die HEMA accepteert voor koffie, thee en cacao.
Tony’s open Chain is een initiatief dat streeft naar een transparante cacaoketen, waar boeren een eerlijke prijs ontvangen voor hun cacao.
a few examples
meat (Beter Leven quality mark)
We took an important step in the first half of 2024: our smoked sausage has now switched to the 1-star Beter Leven quality mark. As this product accounted for almost 90% of the total weight of meat purchased in 2023, we expect our impact to visibly increase in 2025.
Note that due to a changed calculation method (from number of labelled items to weight of purchased labelled meat), the progress in 2024 is not yet fully visible in the figures, but the real impact is significant.
wood and paper
Most of the wood and paper range is FSC-certified. About 12% of the total weight purchased is covered by the EU Ecolabel, which mainly concerns copying paper, which has a large share due to its volume.
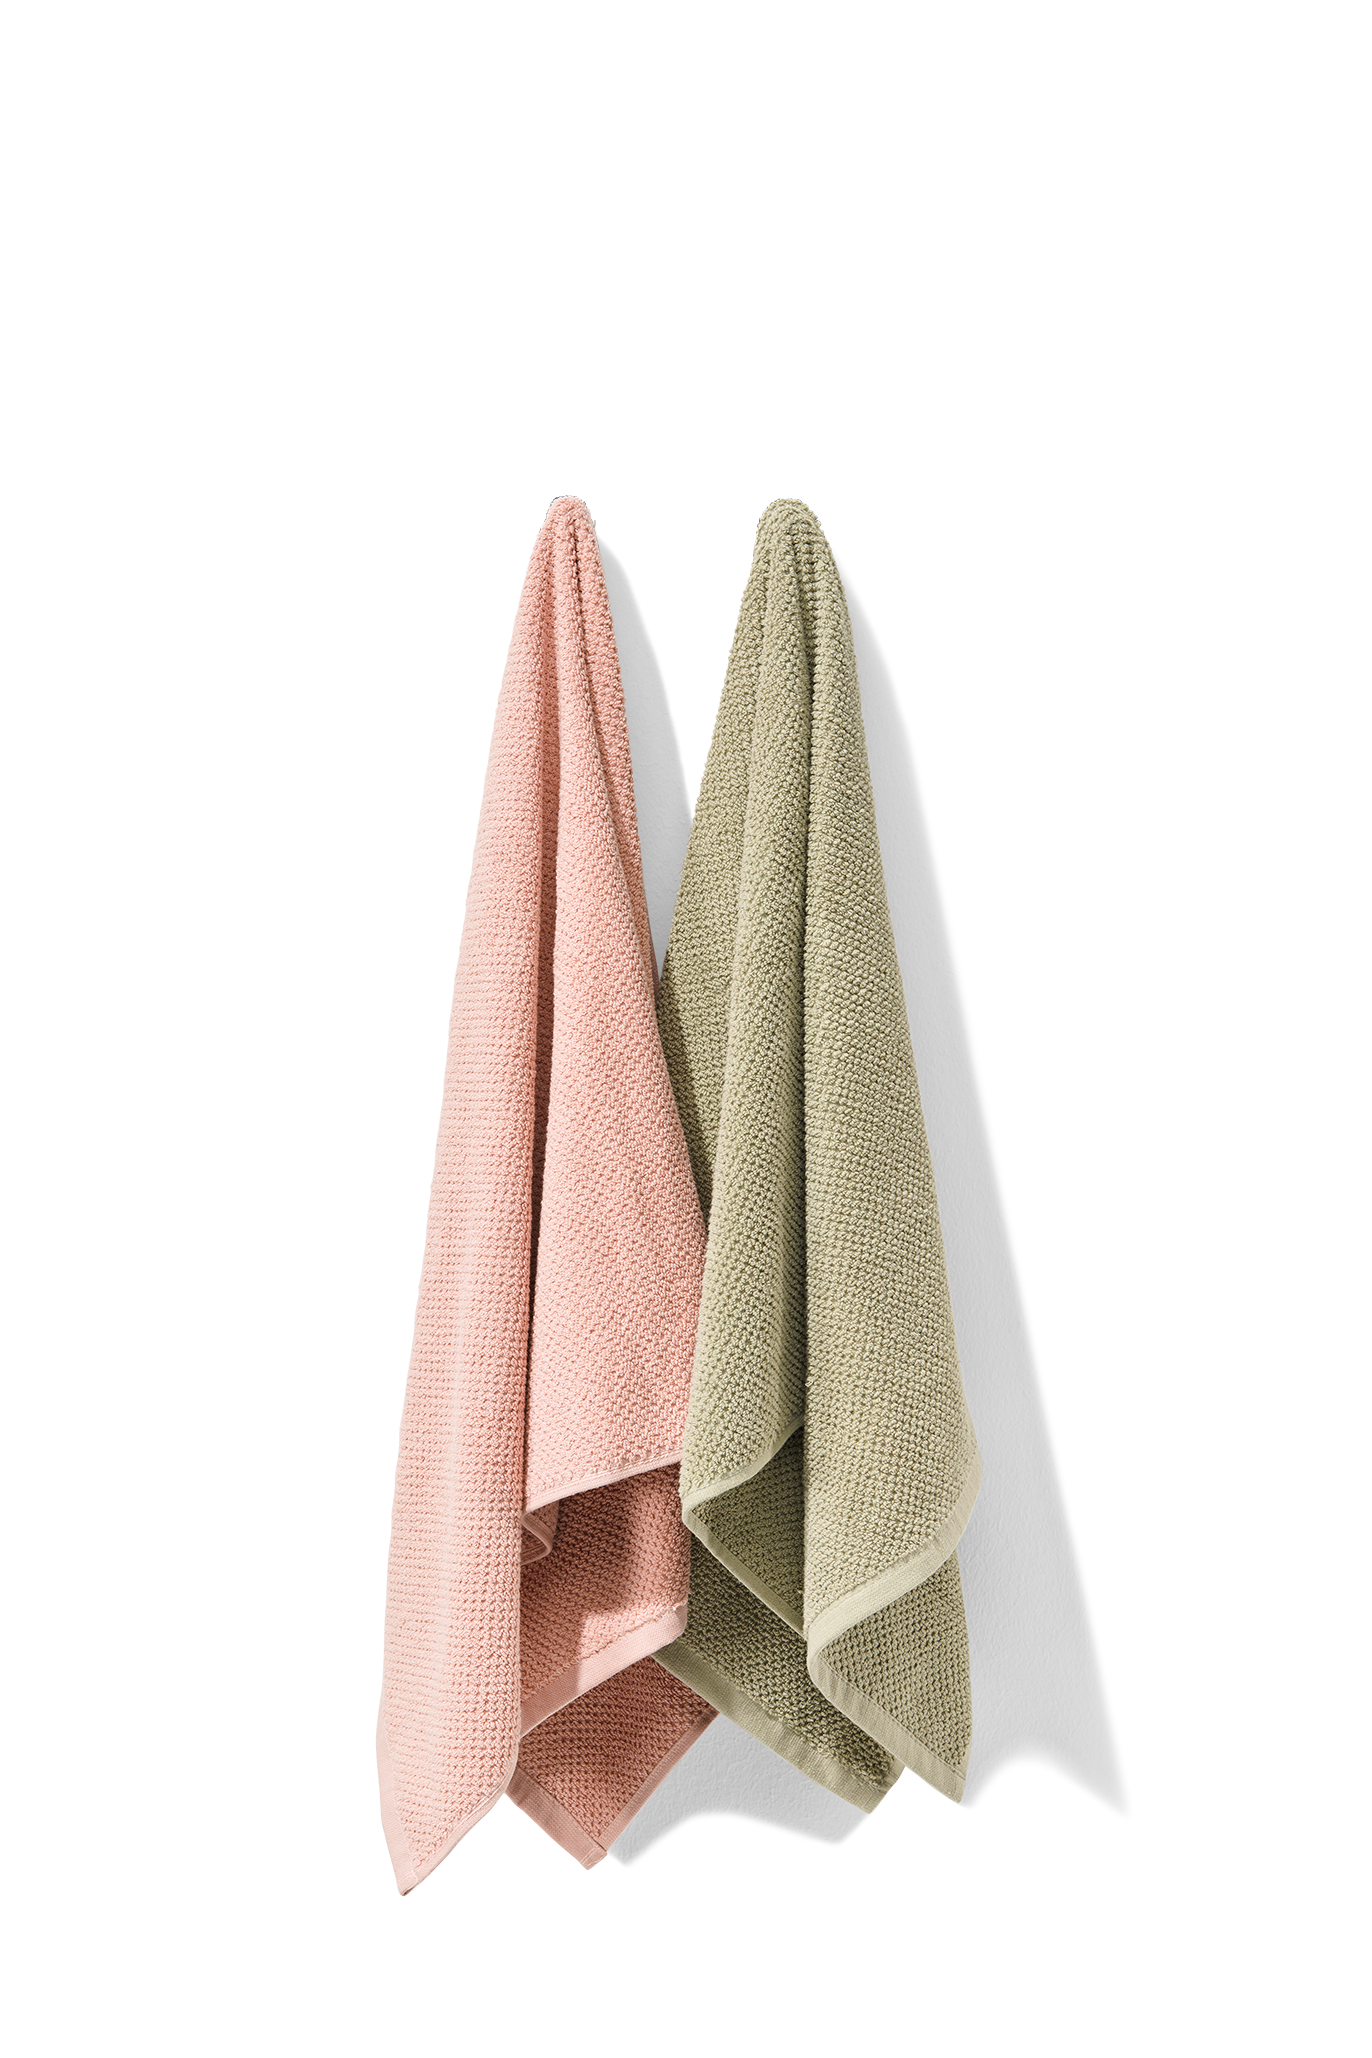
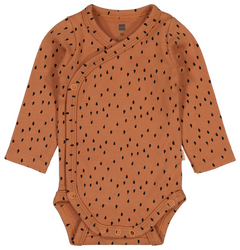
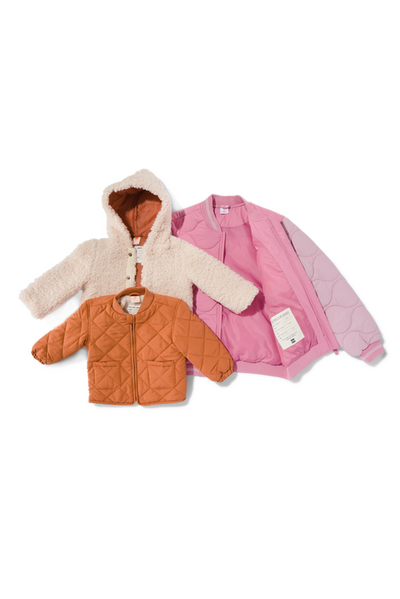
cotton
In 2024, all our baby clothes switched to organic cotton. We are also exploring the use of innovative materials such as Lyocell - a fabric similar to viscose, but with better material properties and a more environmentally friendly production process.
food
Results in 2024.
100%
Fairtrade
tea
100%
Fairtrade of Rainforest Alliance
coffee
99,3%
Fairtrade of Rainforest Alliance
cacao
99,8%
RSPO
palm oil
63%
minimum 1* Beter Leven
meat
96%
organic or pasture
fresh dairy products
93%
MSC of ASC
fish
quality marks
food
cacao
tea
coffee
palm oil
meat
fresh dairy
products
fish
2021
100%
88%
100%
100%
60%
77%
88%
2022
100%
100%
100%
100%
66%
81%
86%
2023
100%
100%
100%
100%
62%
64%
86%
coffee and tea: share of product delivered by weight
cocoa, palm oil, meat, dairy and fish: share by weight of ingredient supplied
The percentages have been calculated differently from 2024 on the basis of purchased volume. By contrast, previous years looked at the proportion of the assortment with a quality label. The purchased volume gives a more accurate picture of our actual impact. Therefore, the 2024 figures are not comparable with previous years.
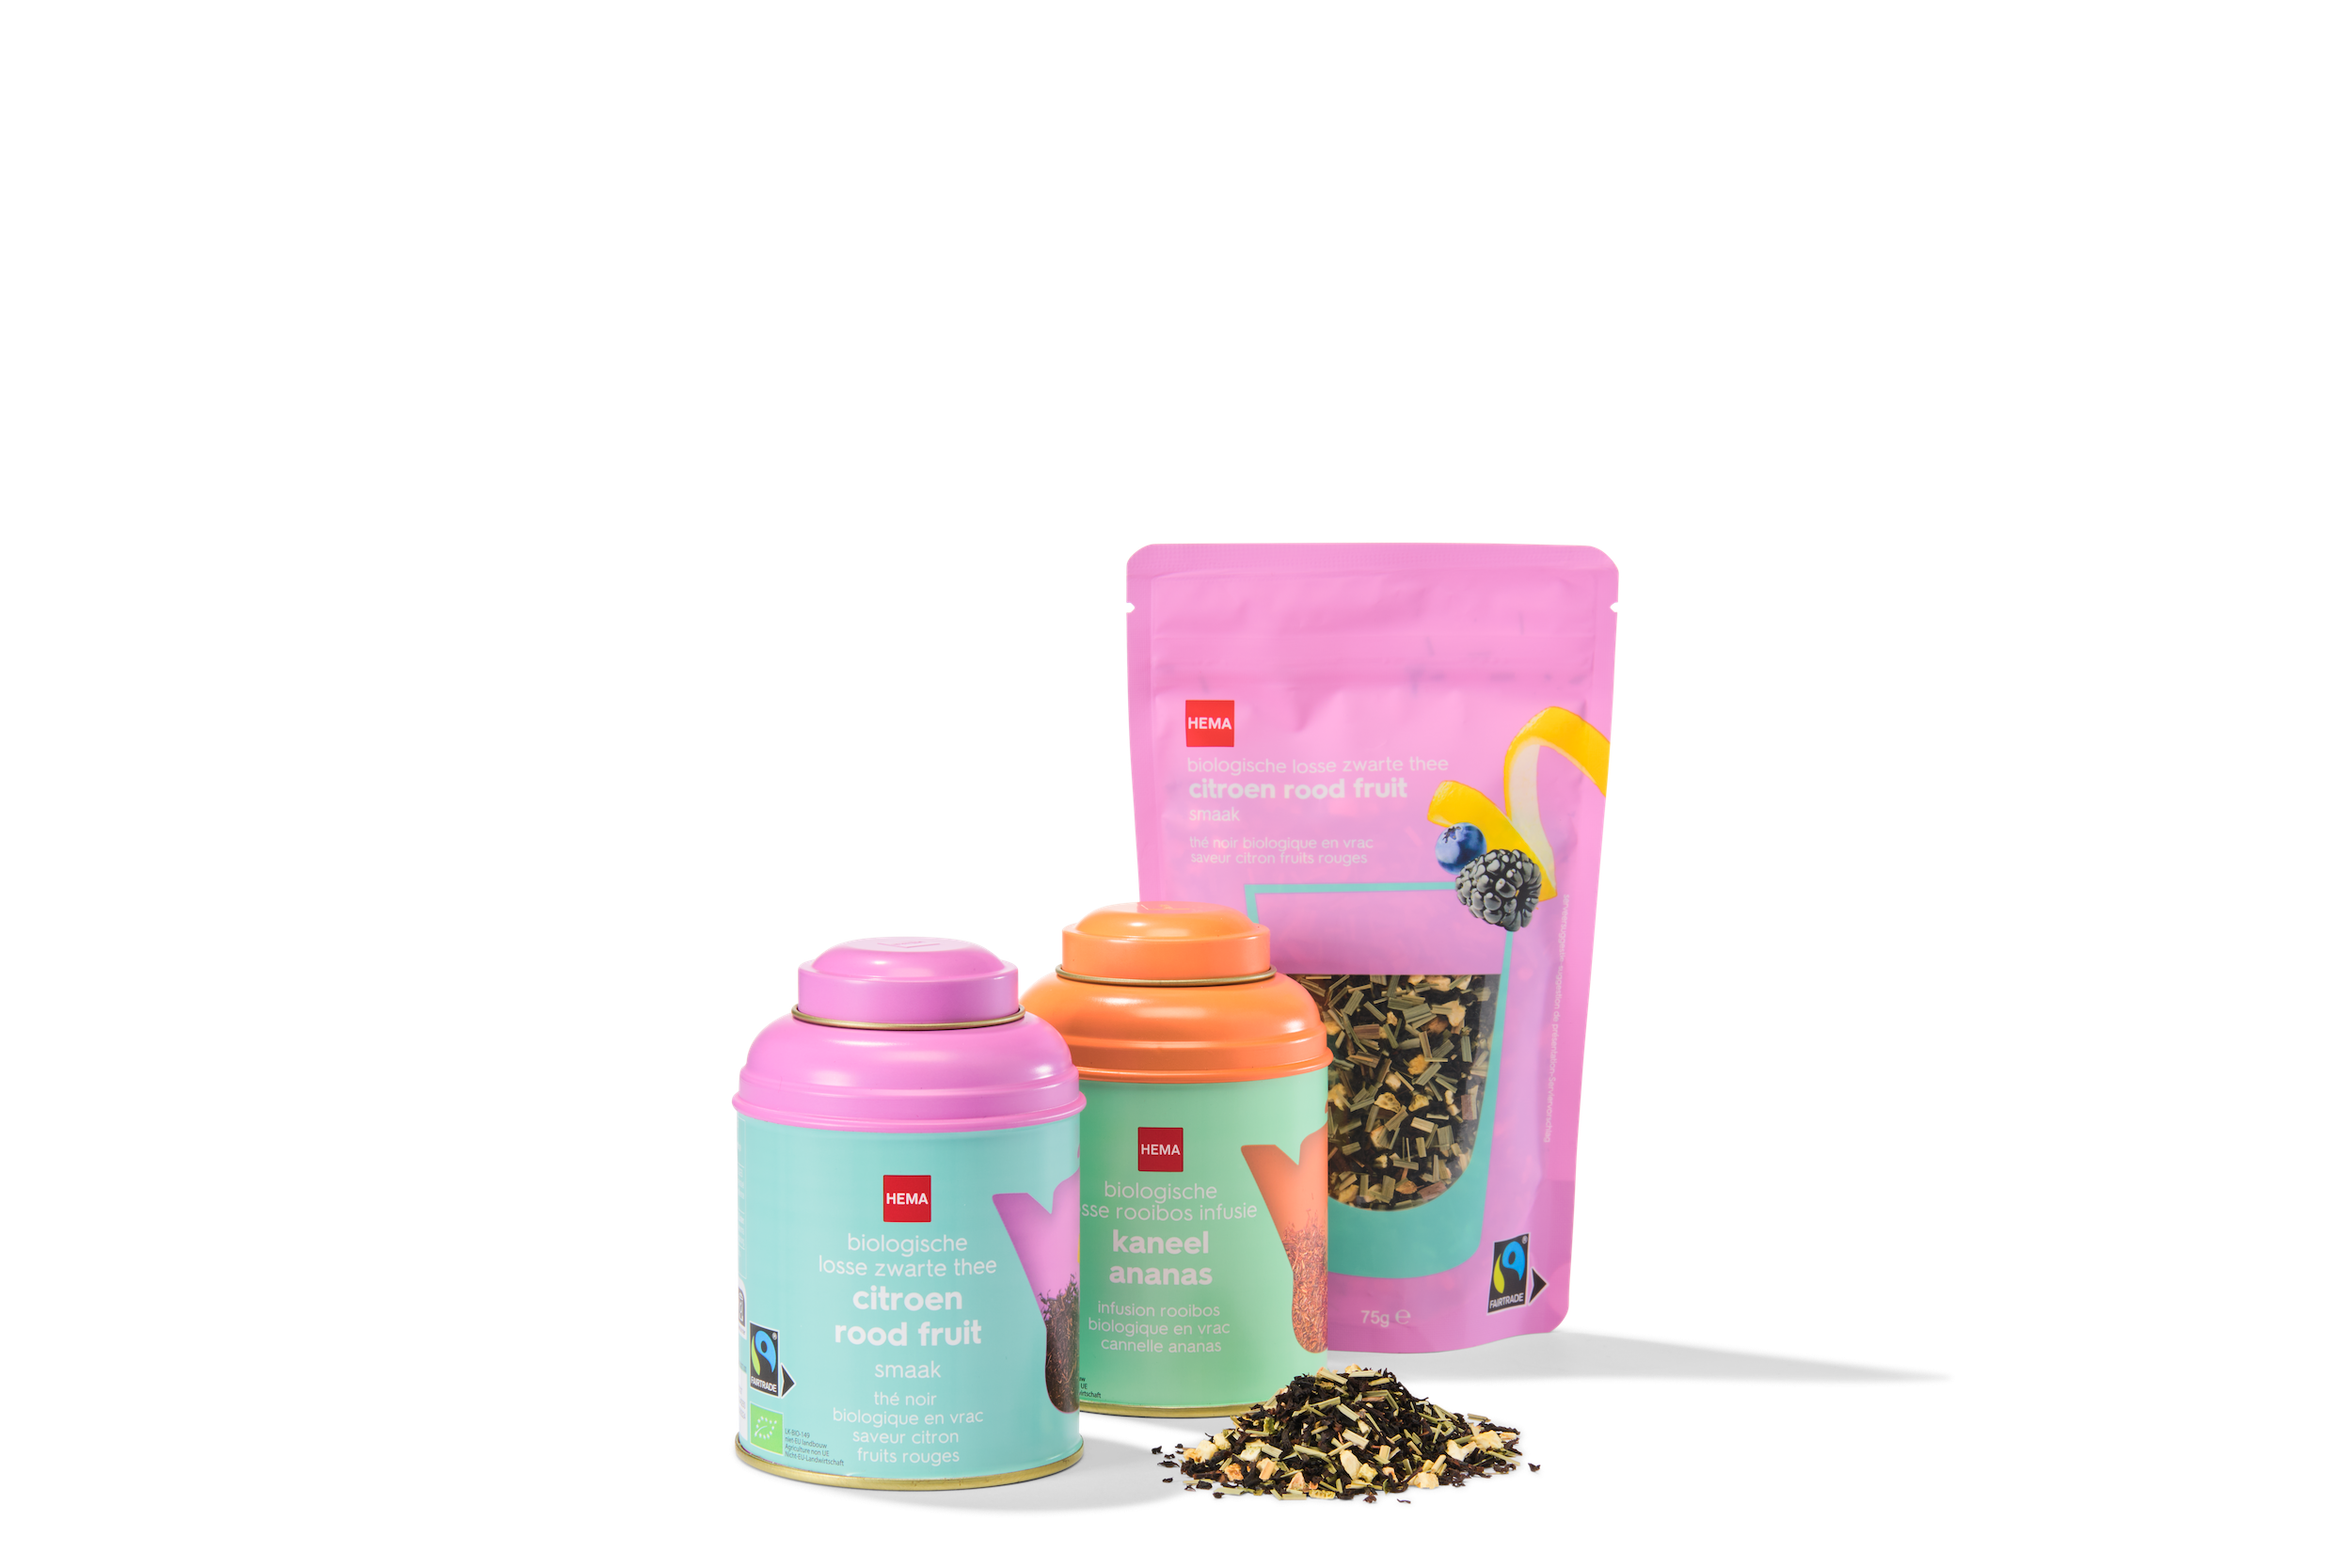
In 2024, 100%* of HEMA's own-brand coffee and tea products (delivered in FY2024) has a Rainforest Alliance, Fairtrade or Organic label (excluding restaurant/takeaway and pastries).
In 2024 99.3%* of HEMA's own-brand cocoa-based products (delivered in financial year 2024) has a Rainforest Alliance, Fairtrade or Organic label. (excluding restaurant/takeaway and cakes).
* Data in 2024 is presented based on the accounting policies and definitions described below and is subject to a limited assurance engagement under NV COS 3000. View the independent auditor's report here.
methodology and assumptions
The period covers products delivered to HEMA in the financial year 2024, which ran from 29 January 2024 to 2 February 2025. Only HEMA own-brand products are included in the scope. In addition, only long-life and fresh products sold in the shop were considered; products sold in our restaurants, takeaways and in our pastry department were not included. Under coffee and tea, hot drinks are included, so not, for example, Easter eggs with coffee extract. Total weights per product from the food specification system were linked to the numbers of products delivered to arrive at a total weight of products delivered.
For cocoa, all products containing cocoa as an ingredient were included. We looked at the weight of cocoa ingredients in these products.
Rainforest Alliance, Fairtrade and organic are labels certified by an independent party. These are the only labels HEMA accepts for coffee, tea and
cocoa.
non-food
Results in 2024.
96,4%
organic or Better Cotton
cotton
100%
RDS
down
96%
FSC
wood & paper
99%
RSPO
palm oil (cosmetics)
quality marks
non-food
cotton
down
wood & paper
palm oil
(cosmetics)
2021
100%
100%
94,6%
91,4%
2022
100%
100%
95,34%
94,9%
2023
100%
100%
88%
97,5%
Cotton, down, wood & paper: proportion by weight of material purchased palm oil (cosmetics): share of number of products purchased
The percentages have been calculated differently from 2024 on the basis of purchased volume. By contrast, previous years looked at the proportion of the assortment with a quality label. The purchased volume gives a more accurate picture of our actual impact. Therefore, the 2024 figures are not comparable with previous years.
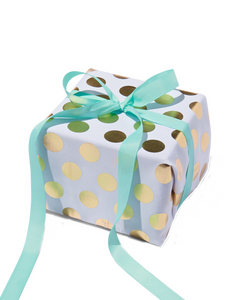
packaging
HEMA uses different types of packaging: consumer packaging, which goes home with the customer, and outer packaging, which holds together and protects multiple products during transport to the distribution centre and shops. For years, we have been committed to reducing the environmental impact of packaging, constantly looking for better alternatives.
Our specialists focused on the following actions and associated targets in 2024:
- Reducing packaging materials.
- Using recycled or renewable materials.
- Promoting recyclability and reusability of packaging.
the results we have achieved
reducing packaging material
8
%
less consumer packaging
36
%
less plastic in consumer packaging
in 2024
For each item, we carefully record the packaging used and the materials it is made of, and we calculate the amount of packaging material per item. By comparing this with the weight in the reference year 2019, we can properly monitor our progress.
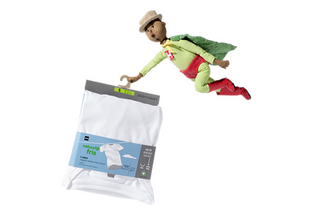
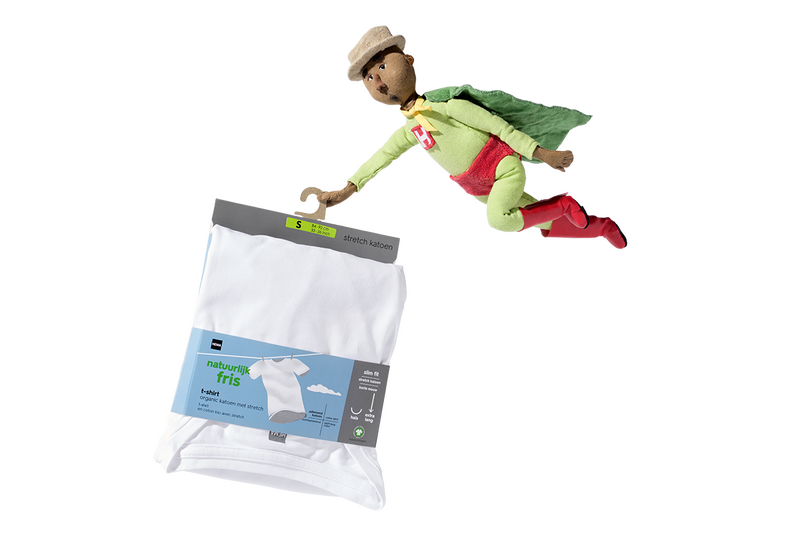
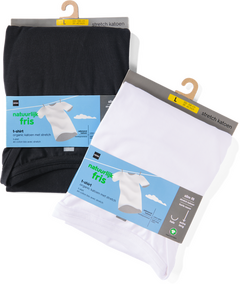
In 2024, we used an impressive 36% less plastic than in 2019. We have already achieved the 25% reduction target by 2023 and will continue to do so in 2024. We have reduced plastic use in all product groups. One way we achieved this was to stop packing men's T-shirts in plastic and present them in cardboard packaging. We also did this with children's pyjamas, eliminating the need for plastic hangers.
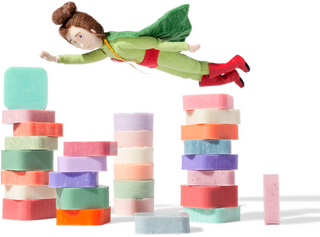
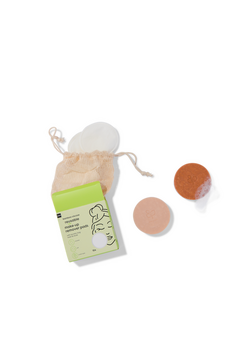
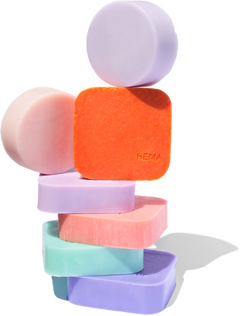
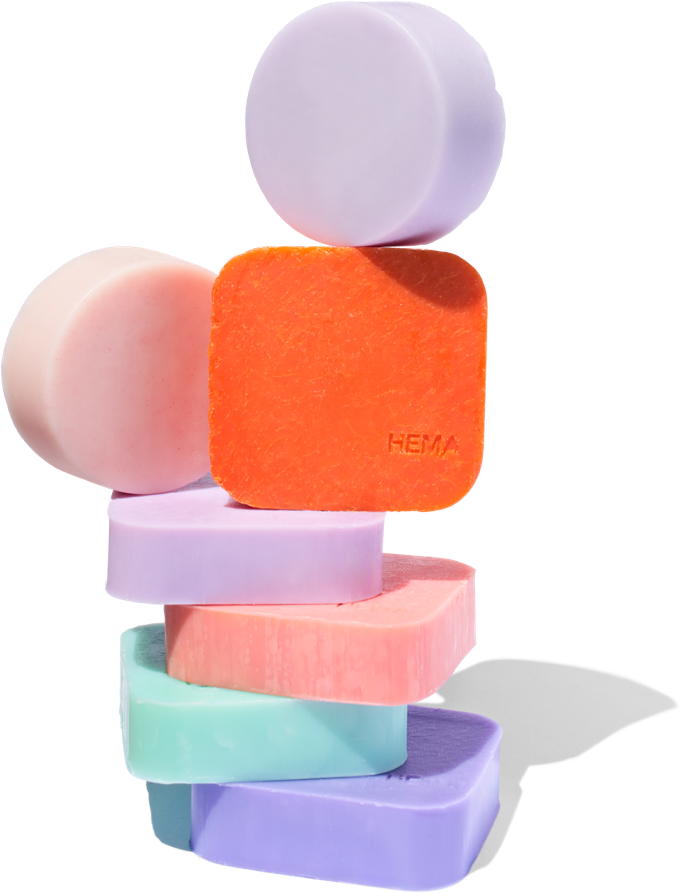
Another solution to use less packaging material is to modify products themselves. Like our grooming blocks: instead of liquid soap or shampoo in plastic bottles, we pack blocks in cardboard boxes. This not only saves packaging material but also transport because we no longer transport water.
We were able to reduce the total packaging weight per item by 8% last year. We do not expect to fully meet the target of 25% total reduction by 2025. We continue to focus on reducing plastic packaging and improving recyclability. In many cases, paper and cardboard is the best solution, even if it results in heavier packaging. Also because paper and cardboard are easier to recycle than plastics from renewable sources. Our aim remains to use no more packaging material than in 2019.
recycled and renewable materials
10
%
recycled or biobased plastic in consumer packaging
in 2024
We aim to use renewable and recycled materials in our packaging. For paper and board, we prefer FSC-certified or recycled paper and board. For plastic packaging, we want to use 20% recycled or bio-based by 2025.
For our consumer packaging, this remains a challenge. Recycled plastic is expensive, not suitable for all applications and has limited availability. Consider, for example, cosmetics and food packaging, where there are strict requirements on the use of recycled plastic. This leaves this target difficult to achieve: In 2024, 10% of plastic comes from recycled sources. We therefore prioritise reducing plastic as a packaging material and making our packaging recyclable.
recyclability
78
%
recyclable packaging
in 2024
When our customers dispose of packaging after use, we do our best to ensure that it can be recycled. This is why we pay attention to the materials used and composition when developing packaging. For example, packaging made of one type of material (mono-material) is more recyclable than combinations of materials, such as plastic and cardboard. For example, we try to replace as much blister packaging (packaging made of plastic glued to cardboard) as possible with easily recyclable solutions made of cardboard only, for example. For instance, we have replaced almost all plastic hooks with cardboard ones.
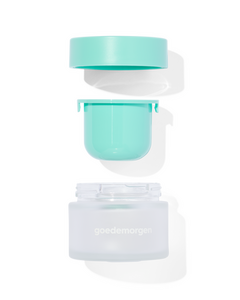
We are also relying more and more on reusable packaging. For instance, 2024 introduced several products that customers can refill at home. Like the refillable packaging for shower gel, shampoo, conditioner and hand soap. This saves almost 75% plastic each time the bottle is refilled. Another example is our day and night creams; thanks to the handy refill system, you place a new cup in the reusable glass cream jar.
Our goal is to make all packaging recyclable or reusable by 2025. For outer packaging, we have already achieved this for several years, with 100% recyclability. For consumer packaging, the rate currently stands at 78% which is slightly lower than a year earlier (-1% vs 2023). The biggest challenge is in food and beauty packaging. Cosmetics packaging, such as lipstick and mascara, is often too small to be recycled, while food packaging is often made of multiple materials to extend shelf life. This makes them difficult to recycle.
Looking ahead to 2025, we expect that the target of fully recyclable packaging will not be achievable. We aim to achieve 80% recyclability for our consumer packaging by 2025 and continue to work towards fully recyclable packaging after 2025. Our current targets expire in 2025, so we will revise our targets next year with a view to 2030.
We use knowledge and tools from various stakeholders and interested parties, such as recycling checks from the 'Sustainable Packaging Knowledge Institute' (KIDV), to determine which solutions are the most recyclable.
the results we have achieved
8%
less consumer packaging in 2024
objective in 2025
25%

actions and goals
base year 2019
less consumer packaging
2022
0%
2023
4%
2024
8%
This is based on the weight per item purchased.
We report on all items with a HEMA logo purchased in this financial year. We compare the amount of packaging material per item to our 2019 comparison year.
36%
less plastic in consumer packaging in 2024
objective in 2025
25%
actions and goals
base year 2019
less plastic in consumer packaging
2022
23%
2023
29%
2024
36%
We report on all items with a HEMA logo purchased in this financial year. We compare the amount of packaging material per item to our 2019 comparison year.
10%
recycled or biobased plastic in consumer packaging in 2024
objective in 2025
20%
actions and goals
percentage recycled or biobased plastic in consumer packaging
2022
13%
2023
12%
2024
10%
Average reduction in kilograms of plastic consumer packaging
% recycled plastic in kg in consumer packaging. We report on all items with a HEMA logo that we purchased this financial year. We calculate what percentage of plastic weight comes from recycled or bio-based sources compared to the total weight of plastic consumer packaging.
78%
recyclable consumer packaging in 2024
objective in 2025
100%
actions and goals
recyclable consumer packaging
2022
64%
2023
79%
2024
78%
We report on all items with a HEMA logo that we purchased this financial year. We calculate the percentage of packaging weight that is recyclable compared to the total weight according to KIDV's recycling checks.